

XRP may be on the verge of a significant 2,105% upsurge to greater heights following the formation of a multi-year cup and handle pattern.
Market analyst Bobby A disclosed this in a recent analysis, choosing to let XRP’s monthly chart speak for itself. The cup and handle pattern is largely visible on the monthly timeframe, suggesting a potential breakout, with Bobby A’s ultimate price target requiring a massive 2,105% increase from current levels.
XRP Forms Multi-Year Cup and Handle Pattern
Notably, XRP formed the cup after it collapsed from the $3.31 all-time high in January 2018. Amid the correction, XRP dropped to a low of $0.1140, marking the rounded bottom of the cup. XRP then recovered from this low, spiking to a high of $1.96 in April 2021. This formed the second high of the cup.
However, data from Bobby A’s chart shows that the handle formed following the retracement from the $1.96 high. XRP has largely been consolidating since then, leading to the handle formation and setting the stage for a significant breakout.
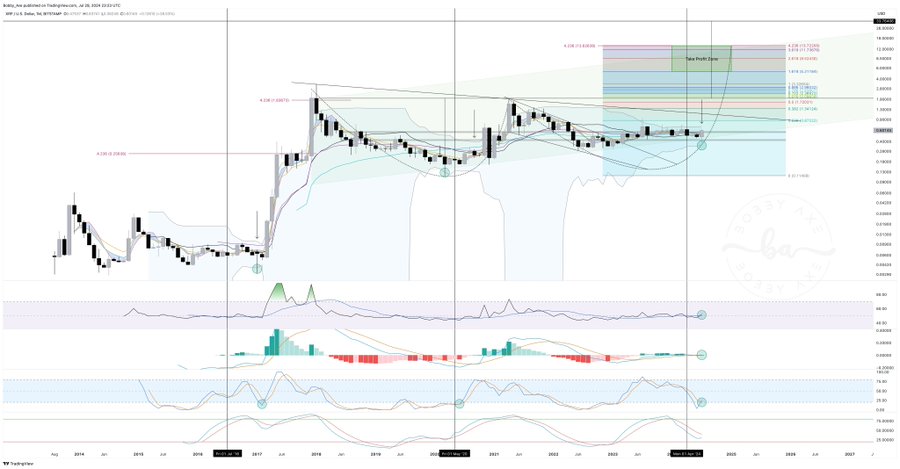

The chart indicates significant horizontal support around $0.19. Bobby A showed that the 50, 100, and 200-month moving averages are converging, which often precedes major price actions.
In addition, the monthly XRP RSI is around 50, indicating a neutral zone. The MACD shows a bullish crossover, where the MACD line crosses above the signal line. This suggests increasing bullish momentum. Meanwhile, the Stochastic Oscillator also indicates a bullish crossover in the oversold region, bolstering the positive outlook.
The chart further reveals descending trendlines from XRP’s all-time high that the asset has tested multiple times. A break above these trendlines often signals a shift from a downtrend to an uptrend. This is crucial for XRP, as breaking these lines can lead to substantial price movements.
An Ultimate $13.7 Target
When such movements occur, Bobby A sets several Fibonacci targets. These levels mark potential resistance and target zones. Key levels include the 1.618 extension at $3.13 and the 2.618 extension near $6.32. The analyst presents an ultimate target of $13.7, which represents a 2,105% increase from the current level.
Meanwhile, XRP currently changes hands at $0.6212, having increased 3.21% over the last 24 hours. XRP trades near the upper band of the envelope indicator. This indicares a strong upward trend. The middle line of the envelope ($0.5749) acts as a dynamic support. This level supports the price during pullbacks.

Further, the Advance Decline Ratio (ADR) at 1.42 indicates a healthy buying pressure. This ratio assesses the number of advancing prices against declining ones. A value above 1 signifies more prices are rising than falling, indicating bullish sentiment.
DisClamier: This content is informational and should not be considered financial advice. The views expressed in this article may include the author's personal opinions and do not reflect The Crypto Basic opinion. Readers are encouraged to do thorough research before making any investment decisions. The Crypto Basic is not responsible for any financial losses.