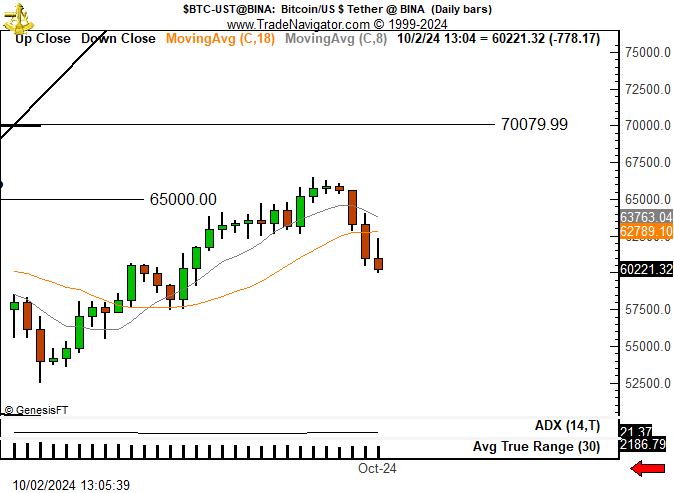
Bitcoin has recently taken a dip after reaching a two-month high, with market veteran Peter Brandt pointing out an unusual trading pattern.
As the leading cryptocurrency struggles to regain its footing following a sharp correction, Brandt recently presented the investing public with a pattern he calls the “Three Blind Mice and a Piece of Cheese.”
Bitcoin Faces Sharp Retracement
Toward the end of September, Bitcoin hit a high of $66,508, marking its best performance in two months. However, the excitement was short-lived, as the firstborn crypto retraced by more than 7.7% over the following days, dropping to around $60,221 yesterday.
Brandt’s 1-day chart shows three consecutive bearish daily candles, with prices sliding below important technical levels. Amid the correction, analysts wonder if the worst is yet to come or if Bitcoin is preparing for another breakout.

This downturn coincides with growing global uncertainty, especially surrounding tensions in the Middle East, which has led investors to shy away from riskier assets like cryptocurrencies. The bearish resolve has neutralized the bullish momentum expected in “Uptober.”
Brandt’s “three blind mice” pattern has further bolstered concerns around Bitcoin’s price action. Although he has not fully explained this term, some analysts suggest it may refer to a continuation pattern, where the price is likely to follow the established bearish trend from the three bearish candles.
Analysts refer to similar setups, such as the “Three Black Crows” pattern, as a bearish signal that a market is losing steam and could face continued selling pressure. With Bitcoin now trading below two key moving averages, the short-term outlook appears dim.
Bitcoin’s Technicals Look Dim
Brandt’s chart shows that Bitcoin’s current price sits below the 8-day and 18-day moving averages. This signals weakness in the short term, implying that sellers have gained control. If Bitcoin does not recover above these levels soon, further losses could spring up.
Meanwhile, the ADX is hovering around 21.37. This number suggests that the current trend lacks strength. The positioning indicates that the market is in a consolidation phase, but the risk of further downward movement remains high. Brandt previously suggested BTC is still in the bearish phase.
Despite the recent downturn, Bitcoin’s psychological and technical support at $60,000 remains intact for now. If the price breaks below this level, it could lead to another wave of selling. This new wave could push Bitcoin towards the $58,000 mark.
However, the ATR shows rising volatility, which means traders should expect larger price swings in the coming days. Despite the difficulty in predicting Bitcoin’s next direction, indicators suggest that a deeper correction is still possible.
While Bitcoin’s decline has disappointed bulls, the market could still experience a reversal. Historically, October has been a strong month for crypto, and if Bitcoin can hold above $60,000, there’s potential for a rebound toward $65,000.
DisClamier: This content is informational and should not be considered financial advice. The views expressed in this article may include the author's personal opinions and do not reflect The Crypto Basic opinion. Readers are encouraged to do thorough research before making any investment decisions. The Crypto Basic is not responsible for any financial losses.


