XRP nears a pivotal support as market analyst CasiTrades tracks its Elliott Wave structure, revealing key levels that may complete corrective Wave 2 setup.
XRP has experienced heightened volatility in recent days, with a downward trend shaping market sentiment. As of April 9, XRP is trading at $1.82, reflecting a notable 3.2% loss in the last 24 hours. Over a seven-day period, the price declined by 12.8%, while the 14-day performance shows a sharper correction of 26.3%.
Despite this short-term pressure, the token has gained 193.6% over the past year, prompting analysts to examine important technical levels that may signal either further losses or a strong reversal.
Golden Ratio Supports and Wave Structure Observed
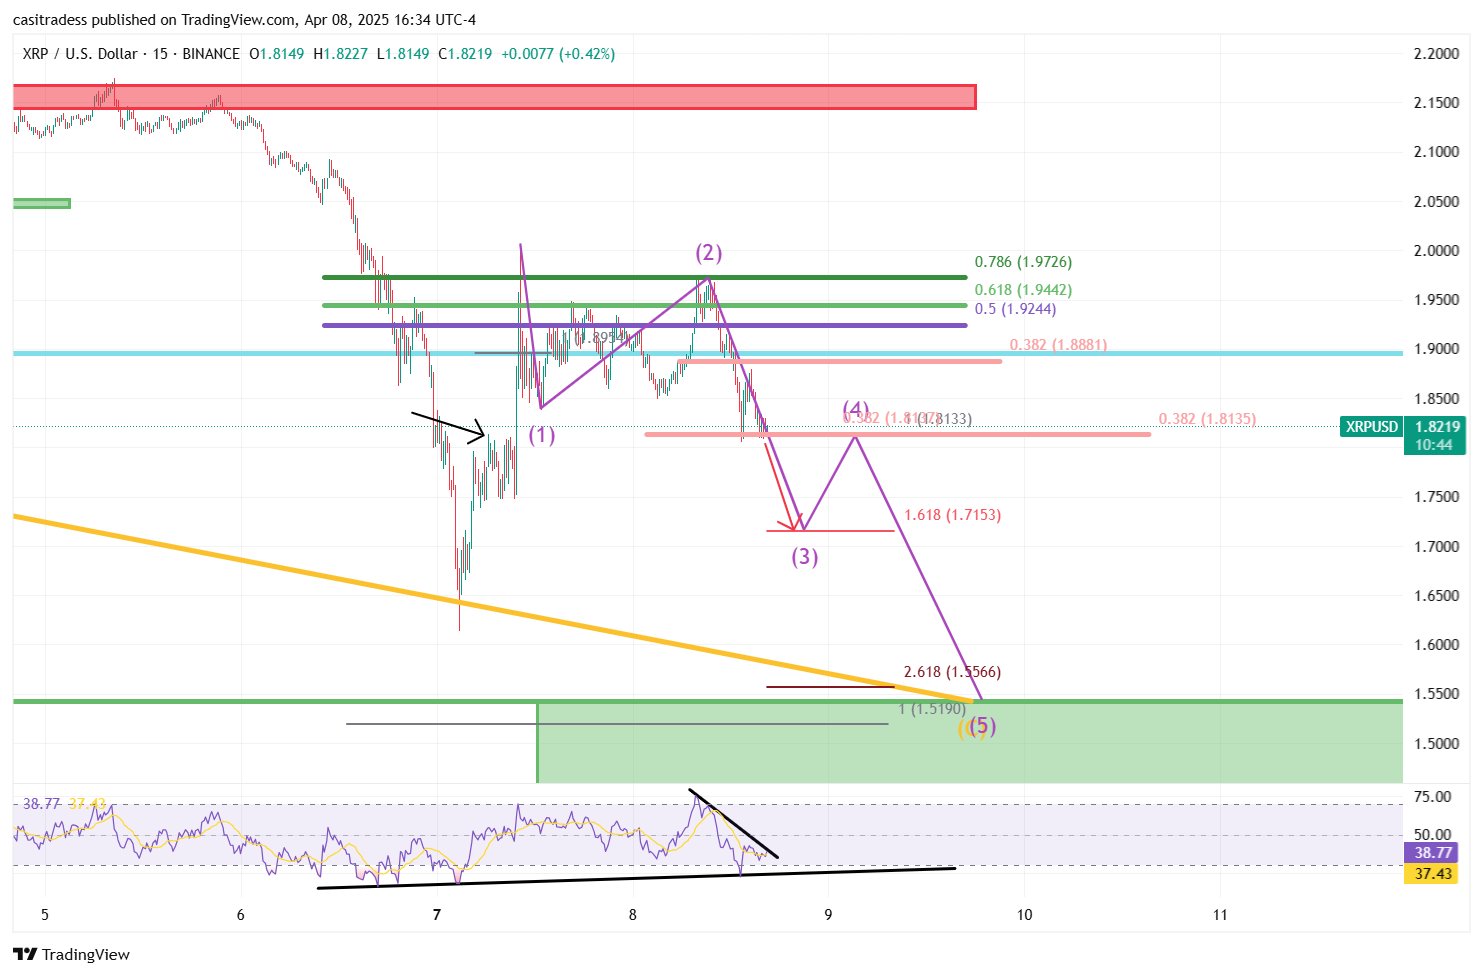
CasiTrades, a technical analyst on X, has been monitoring the recent wave down. According to her analysis, XRP has responded precisely to the subwave 2 target, bouncing off the 0.618 Fibonacci support near $1.55.
This level marks a crucial area in the ongoing corrective Wave 2 structure. Following this rejection, the price may be entering subwave 3, which suggests further downside movement in the immediate term.

Currently, $1.81 is a pivotal threshold. A drop below this level would indicate progression into the final leg of the correction. If the downward move continues, the analyst expects $1.71 to act as a short-term pause before potentially hitting the golden ratio zone at $1.55.
CasiTrades emphasized that completion of this corrective structure could set the stage for a significant upward breakout. The analyst is also tracking the Relative Strength Index (RSI) for possible bullish divergence as further confirmation of a turnaround.
Projection of $4.50 Minimum for XRP
Parallel to CasiTrades’ outlook, another analyst, Dr. Cat, maintains a longer-term target for XRP. The analyst projects a minimum price of $4.50, even under a scenario where Bitcoin’s current bull run fails to reach new highs.
Dr. Cat bases this target on the 1.618 Fibonacci extension from the previous drop. However, his analysis indicates that if XRP closes below $1.69 on a 2-day chart, the projection may need re-evaluation.
Despite recent losses, Dr. Cat estimates a 50% probability that the current dip marks the bottom. This assumption contributes to expectations of a broader rebound, supported by price behavior and technical indicators near support levels.
XRP Road to Potential Breakout
Further adding to the analysis, market expert EGRAG has outlined a sequence of resistance levels that could shape the next major move. The analyst highlights $2.24 as the first key level, matching the 21-day exponential moving average. A close above this mark may indicate early bullish momentum.
Additional levels to monitor include $2.30, $2.47, and $2.70—each corresponding to critical Fibonacci retracement points. Specifically, surpassing the $2.70 resistance may signal the beginning of a stronger upward rally, according to EGRAG’s roadmap.
DisClamier: This content is informational and should not be considered financial advice. The views expressed in this article may include the author's personal opinions and do not reflect The Crypto Basic opinion. Readers are encouraged to do thorough research before making any investment decisions. The Crypto Basic is not responsible for any financial losses.


