

Technical analyst Charting Guy has identified a Shiba Inu price trendline breakout, possibly taking SHIB to December levels.
Shiba Inu recently witnessed a notable shift in its technical setup, following a steady price climb that began around April 22. After bottoming slightly above $0.00001, SHIB advanced to a high near $0.00001510 by April 26. The price then experienced a subsequent retracement toward the $0.0000135 range as of today.
However, key technical observations suggest that SHIB may be forming a base for larger moves, supported by trendline breaks and strengthening oscillator signals.
Major Descending Trendlines Breached
Notably, an analyst on X, Charting Guy, outlined the significance of two descending trendlines that governed SHIB’s action throughout 2024 and early 2025.
The first major downtrend initiated in March 2024, resulting in a series of lower highs and lower lows. SHIB eventually broke above this initial trendline in late 2024, leading to a price spike that hit $0.000031.

Following this breakout and price spike, another descending trendline formed as selling pressure persisted into 2025. However, in mid-April 2025, SHIB breached this second resistance, suggesting a potential shift in market dynamics.
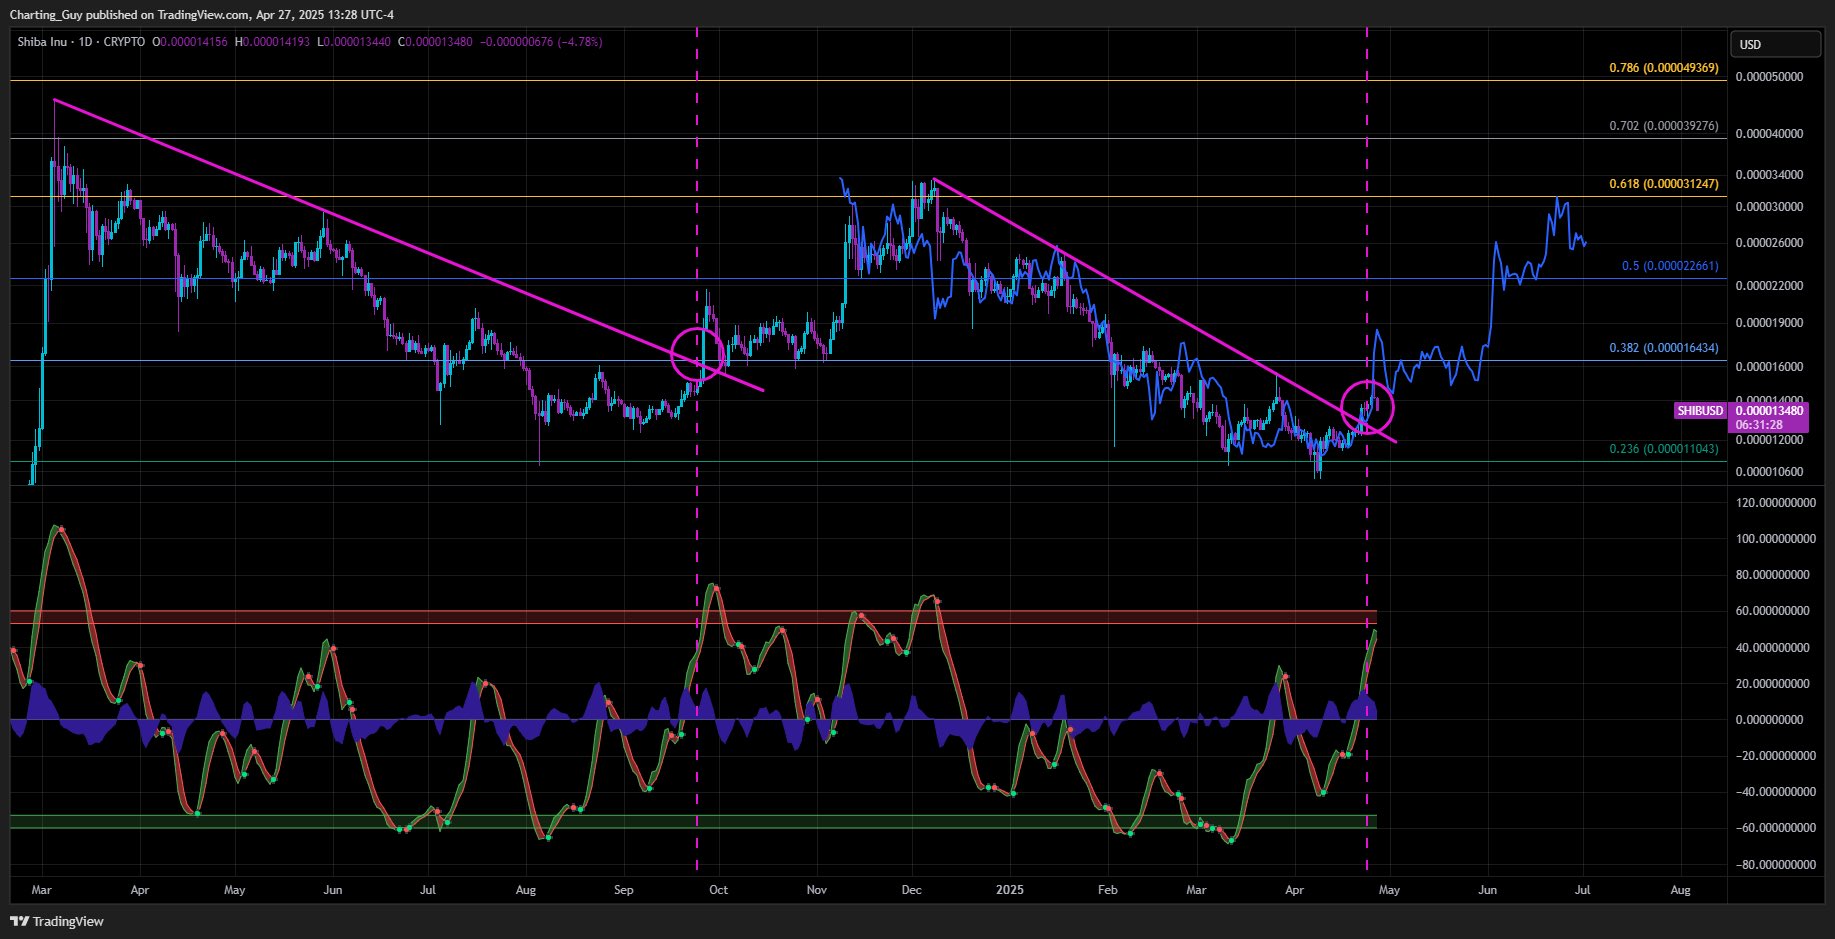
Previously, SHIB attempted to break above the trendline at $0.000026 and just below $0.000016, but lacked sufficient bullish momentum to maintain those moves. However, Charting Guy believes Shiba Inu has overcome this trendline in this recent attempt.
Now, the analyst points to a new target above $0.00003, aligning with the 0.618 Fibonacci retracement zone last observed in December 2024.
Supporting this outlook, the WaveTrend Oscillator, featured below the price chart, shows a notable upward turn after a deep oversold reading below 60. Historically, such movements have preceded sustained rallies in SHIB, providing additional confirmation for the current setup.
Oscillators Show Early Bullish Shifts
Meanwhile, a separate analysis by Charting Guy provided further insight using the weekly SHIB/USD chart. Three key indicators — the RSI, WaveTrend Oscillator, and LMACD — show early signs of bullish reversal patterns.

The RSI, positioned around 40–45, has flattened after a prolonged decline. Although not yet overbought, the RSI remains at levels historically conducive to upside movement once momentum builds.
The weekly WaveTrend Oscillator shows a green dot at its lower boundary, a historical reversal signal. Both oscillating lines are nearing a positive crossover, with histogram bars shifting from negative to neutral. Previous green dots on the weekly chart preceded multi-week price expansions for SHIB.
Other Analysts Seeing Potential in SHIB
Elsewhere, analysis from MMB Trader highlights Shiba Inu’s historical surges. With a baseline support at $0.00001, this analyst projects a target near $0.000037 for SHIB.
Meanwhile, in his commentary, analyst SABoikie argued that Shiba Inu offers an excellent buying opportunity at current levels. He pointed to a possible fractal repetition, projecting a breakout above $0.000014 with an extended target above $0.00010.
DisClamier: This content is informational and should not be considered financial advice. The views expressed in this article may include the author's personal opinions and do not reflect The Crypto Basic opinion. Readers are encouraged to do thorough research before making any investment decisions. The Crypto Basic is not responsible for any financial losses.