

Market watcher “Mister Crypto” highlights recurring Bitcoin cycles and insists that “this time won’t be different,” forecasting another parabolic surge.
Bitcoin’s price has declined to $105,235 today, marking a 2.99% drop over the past 24 hours and a 5.12% decrease over the past week. Despite these recent losses, analysts on social media continue to point to historical patterns that suggest a potential parabolic price rally ahead.
Bitcoin Historical Cycles and Parabolic Phases
Mister Crypto, an analyst on X, has presented a chart tracing Bitcoin’s price history, emphasizing recurring patterns such as rounded bottoms and ascending triangles. These formations have historically preceded parabolic rallies in all major cycles: 2013, 2017, and 2021.
Bitcoin will go parabolic.
This time won’t be different! pic.twitter.com/0fEMMMclbD
— Mister Crypto (@misterrcrypto) May 29, 2025
In 2013, Bitcoin’s price began under $10 and, after consolidating within a rounded bottom and ascending triangle, surged past $1,000 in a parabolic move. A similar pattern occurred in 2017, where nearly three years of consolidation ended with a breakout that drove the price close to $20,000.

The 2021 cycle mirrored earlier ones but on a larger scale. Following almost four years of consolidation in a rounded base, Bitcoin broke out of an ascending triangle and rose parabolically to an all-time high near $70,000.
Mister Crypto argues that this cycle will follow the same path. His chart shows a comparable post-2021 consolidation, suggesting the breakout in 2025 that could lead to a parabolic surge, with price targets reaching as high as $910,000.
A rise from $105,235 to $910,000 would represent an approximate 765% increase.
Accumulation and Re-Accumulation Phases in BTC
Another analyst, Mags, shares a separate chart highlighting Bitcoin’s cyclical behavior. It illustrates an initial “first leg up” marking a transition from accumulation to bullish momentum, followed by a sideways re-accumulation phase.
This pattern has repeated in past cycles, notably from 2019 to 2021, and appears to be forming again from 2023 into 2024 and 2025.
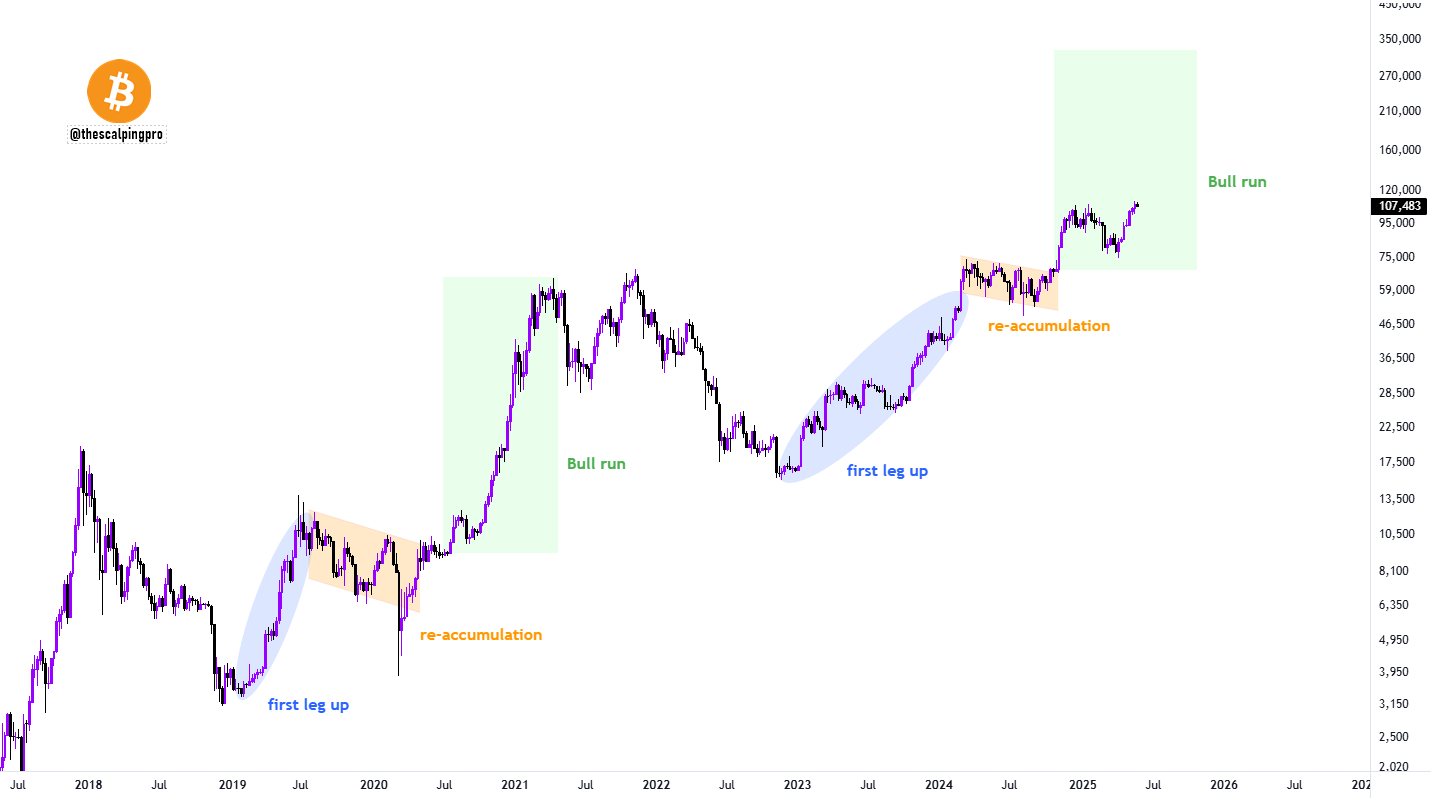
According to this model, the recent price action suggests completion of the re-accumulation phase, positioning Bitcoin to enter a full bull run characterized by rapid price gains. Mags highlights price targets ranging between $270,000 and $350,000, emphasizing the structured phases in Bitcoin’s price evolution.
Long-Term Holders Continue Unprecedented Accumulation
Data shows that long-term holders (LTHs) have increased their Bitcoin holdings by over 1.39 million BTC between March 3 and May 25, 2025. During this period, total LTH supply grew from 14,354,038 BTC to 15,739,438 BTC.
This trend contrasts with previous bull markets in 2013, 2017, and 2021, when long-term holders typically sold to realize gains. While there were brief dips in LTH supply in May 2024 and March 2025, the broader trend of accumulation remained intact.
Analysts note that experienced market participants appear reluctant to sell at current price levels. They warn that continued accumulation could constrain the available supply for new buyers, potentially impacting market liquidity.
DisClamier: This content is informational and should not be considered financial advice. The views expressed in this article may include the author's personal opinions and do not reflect The Crypto Basic opinion. Readers are encouraged to do thorough research before making any investment decisions. The Crypto Basic is not responsible for any financial losses.