

A Diamond Top pattern has formed on the Bitcoin daily chart, signaling a potential bearish reversal to crucial support.
Bitcoin has shown sharp price swings over the past week, maintaining levels above $104,000 after an earlier push past $108,000. Despite the strength, it has failed to stay above that mark, pointing to heavy resistance.
Amid this waning strength, the recent formation of a Diamond Top pattern on the 1-day chart has brought renewed attention to a possible shift in trend.
Diamond Top Pattern Signals Potential Reversal
Analyst The Great Martis, posting on X, identified a Diamond Top pattern, a technical formation typically seen during a slowing rally. The pattern began developing after Bitcoin climbed from $98,000 on May 8 to above $103,000. Since then, the price action has remained mostly constrained within the diamond boundaries.
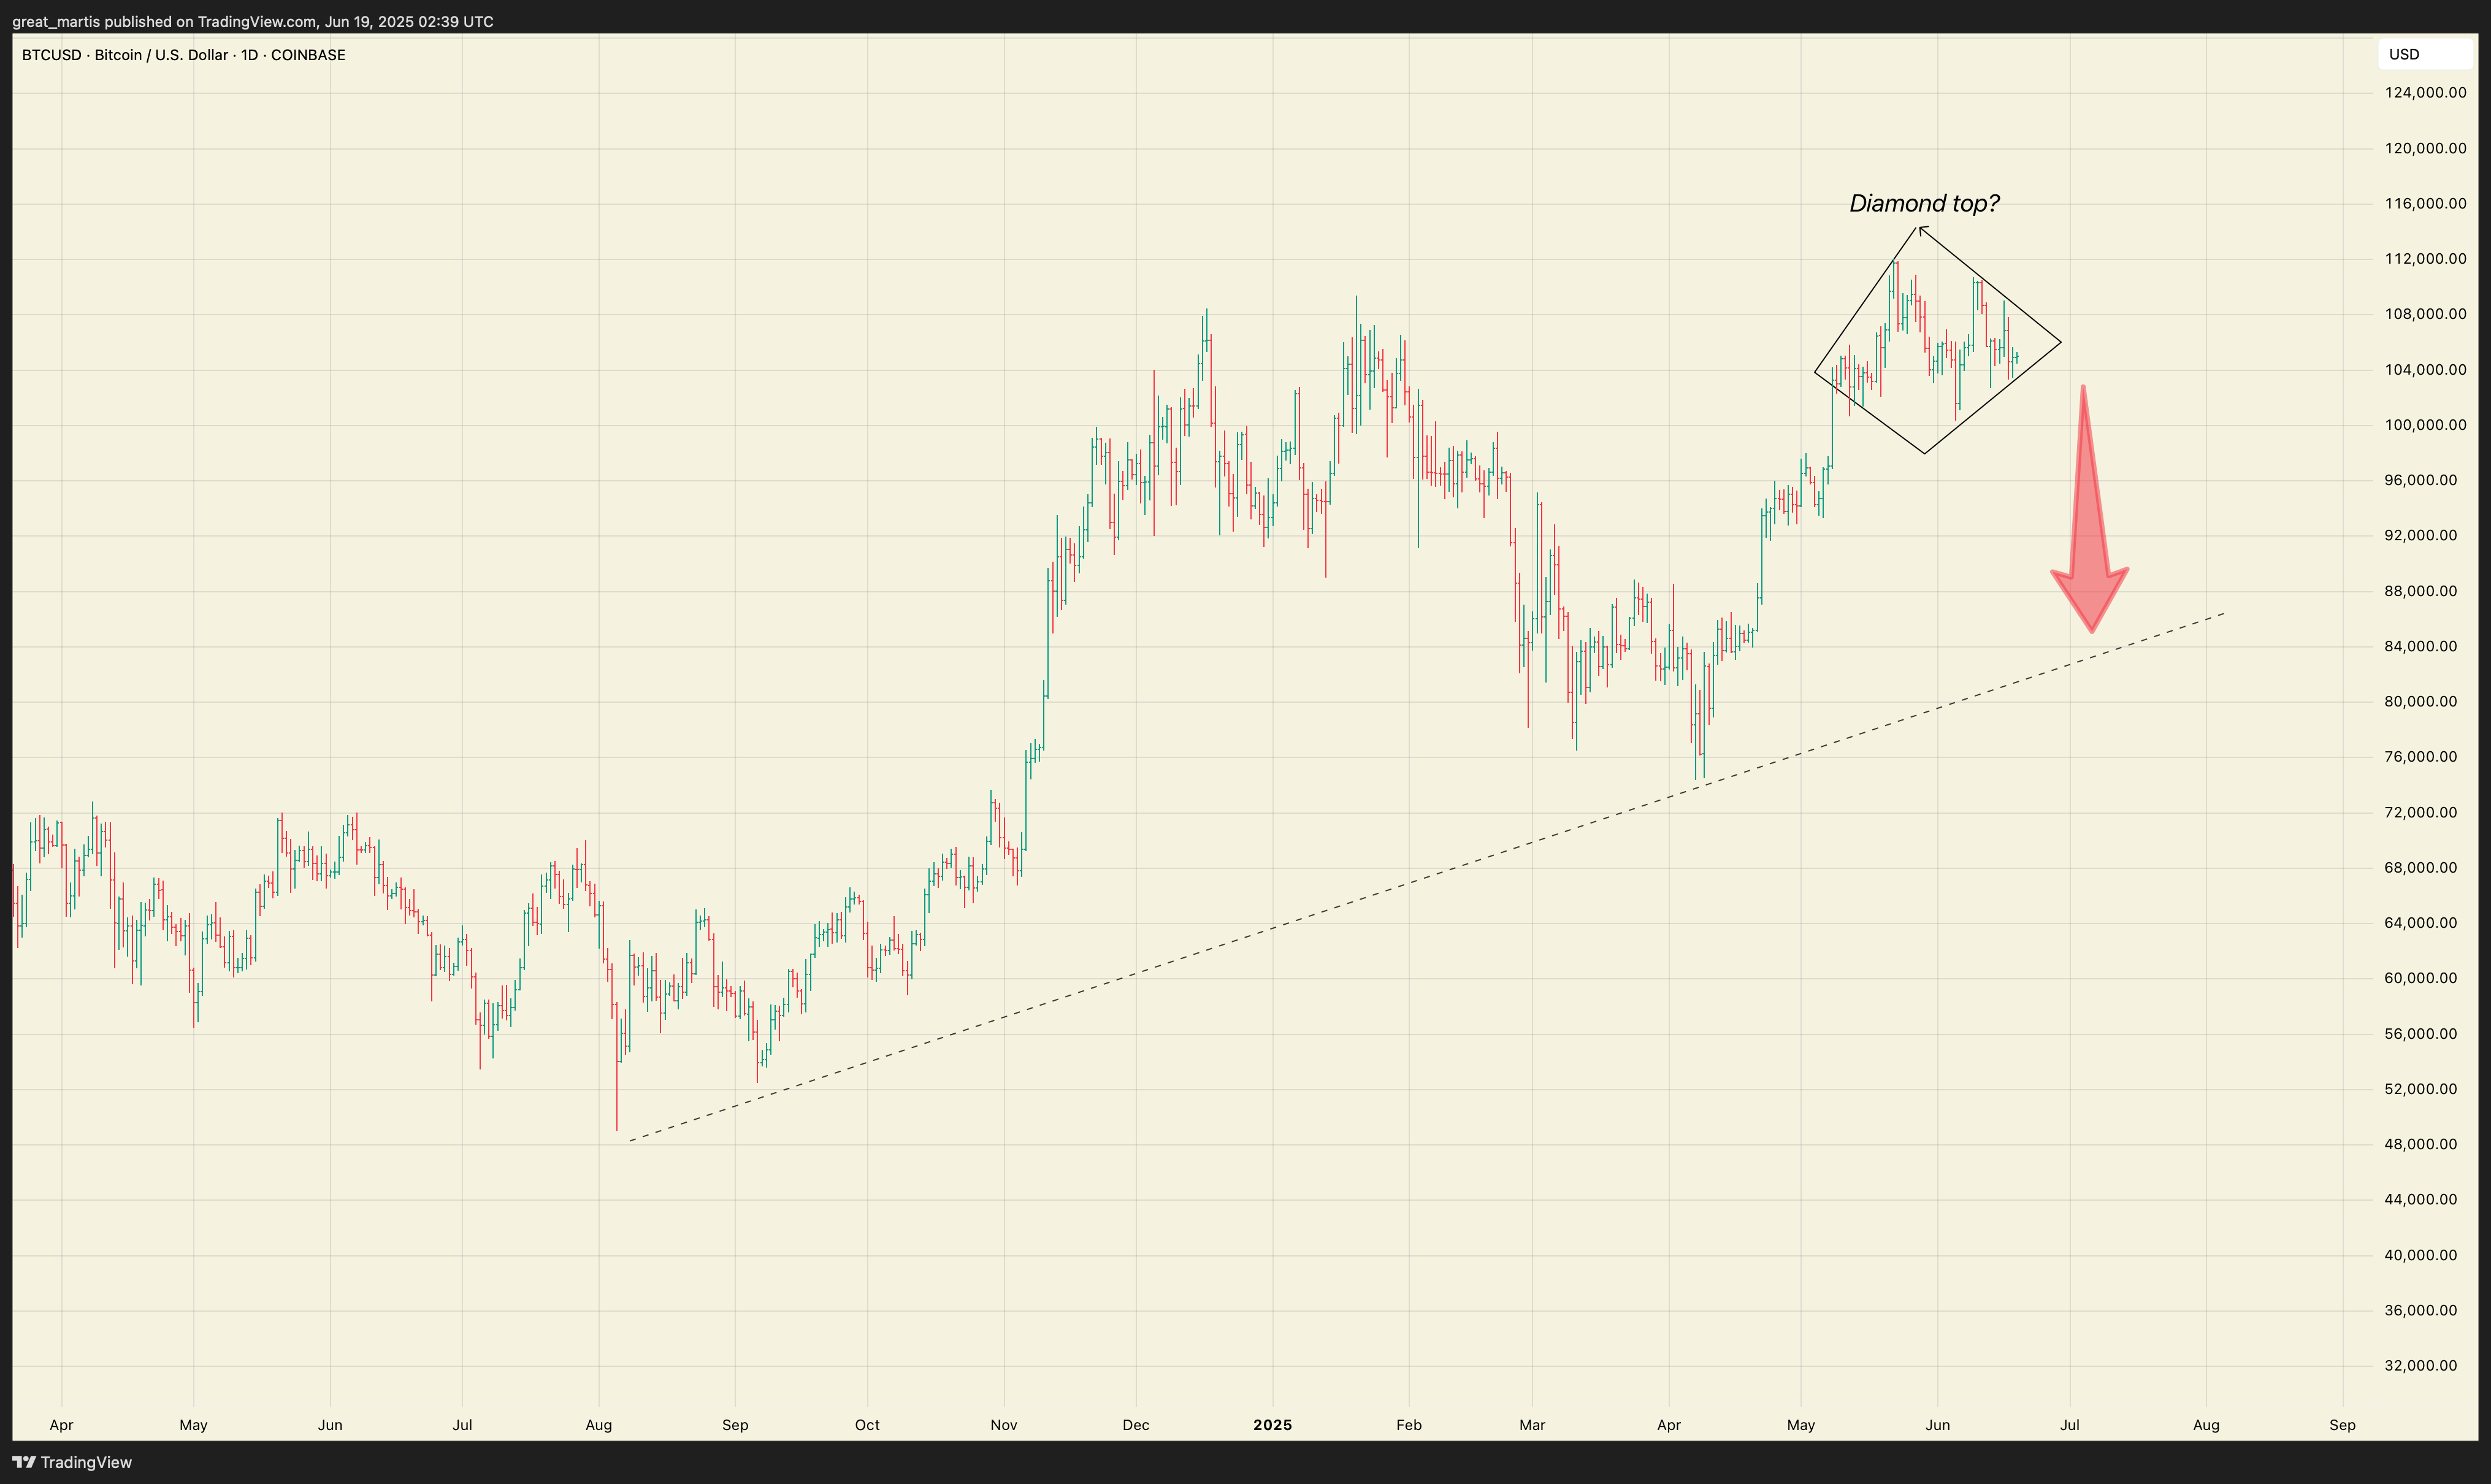

Attempts to break out continued, with Bitcoin pushing near $111,998 on May 22. However, trendlines forming the diamond pattern limited this upward move. Subsequently, by June 5, the asset had dropped to $100,445, only to bounce back as the lower boundary held firm.
Another surge followed on June 9, briefly pushing the price above $110,000. A drop to $102,740 came after escalations in the Middle East conflict, yet the diamond trendline continued to act as support.
Trendline From 2024 Still Providing Support
Meanwhile, parallel to the diamond formation, a dashed ascending trendline that began forming in August 2024 remains intact. This trendline has offered reliable support throughout the ongoing uptrend.
It first held on Sept. 6, 2024, when Bitcoin fell to $52,500 and again on April 9 during a pullback to $74,400. If Bitcoin breaks below the Diamond Top support, this long-term trendline is expected to be the next technical level to watch, as it now sits around the $80,000 price mark.
On-Chain Metrics Show Signs of Overheating
Bitcoin Network data over the last seven days reveals further signs of a slowdown. New Addresses fell 0.93%, while Active Addresses dropped 2.26%.

Moreover, Zero Balance Addresses, which typically reflect new wallet creation, also declined by 2.97%. These figures suggest reduced participation on the network.
Ownership data adds more detail. Bitcoin held by long-term holders—classified as Hodlers (1+ years)—decreased by 0.19%.

In contrast, Cruisers (1–12 months) saw a mild increase of 0.32%. Most notably, the share of BTC held by short-term Traders (less than one month) jumped 1.12%, reflecting increased activity among newer market participants.
A high influx of short-term traders often marks the late stage of bull runs, when fear of missing out kicks in. This is a strong signal of overheating for Bitcoin.
DisClamier: This content is informational and should not be considered financial advice. The views expressed in this article may include the author's personal opinions and do not reflect The Crypto Basic opinion. Readers are encouraged to do thorough research before making any investment decisions. The Crypto Basic is not responsible for any financial losses.