

A market analyst says Dogecoin price path to a key resistance level is open if it holds above support, citing technical and momentum indicators.
The Dogecoin price chart reflects a slow but steady recovery, coupled with a phase of consolidation. Over the past week, DOGE has posted a modest gain of approximately 2.8%.
Despite this positive momentum, the price remains under resistance pressure in the upper $0.17 zone.
Dogecoin Price Forms Double Bottom, Signaling Potential Breakout
Meanwhile, analyst Tom Tucker has identified a classic technical pattern that could signal a bullish breakout. According to his analysis shared on the X platform, the daily DOGE/USDT chart reveals the emergence of a double bottom formation. This well-known reversal pattern has been forming near a strong support level at $0.1467, a zone where buyers have repeatedly stepped in.

The pattern’s double bottom pattern involved two key low points. The first occurred on April 7, 2025, when the price dropped to $0.1299 before rebounding to $0.25. Meanwhile, the second bottom was on June 22, 2025, when the price touched $0.1437 and then recovered again.
These lows, which occurred near the same support zone, highlight persistent buyer interest and underscore the importance of the support level. The neckline of the pattern lies at $0.2596.
Strengthening Signals from RSI, MACD, and Whale Behavior
Supporting the bullish case are several key momentum indicators that point to improving market sentiment. Specifically, the Relative Strength Index (RSI) has recovered above 47 and is now approaching the neutral 50 mark, suggesting that bearish pressure has weakened and momentum is shifting toward buyers.
Meanwhile, the Moving Average Convergence Divergence (MACD) indicator has exhibited a bullish crossover, with the MACD line moving above the signal line, typically interpreted as an early signal of upward momentum.
On the blockchain, whale accumulation is rising, providing additional confirmation. Over the past 30 days, large DOGE holders have increased their share of Dogecoin by 0.34%, while the share held by smaller investors has declined by 2.59%.

This shift in ownership toward whales is generally seen as a bullish indicator, as it suggests strong hands are accumulating DOGE in anticipation of future gains.
Major Dogecoin Price Resistance Levels in Sight
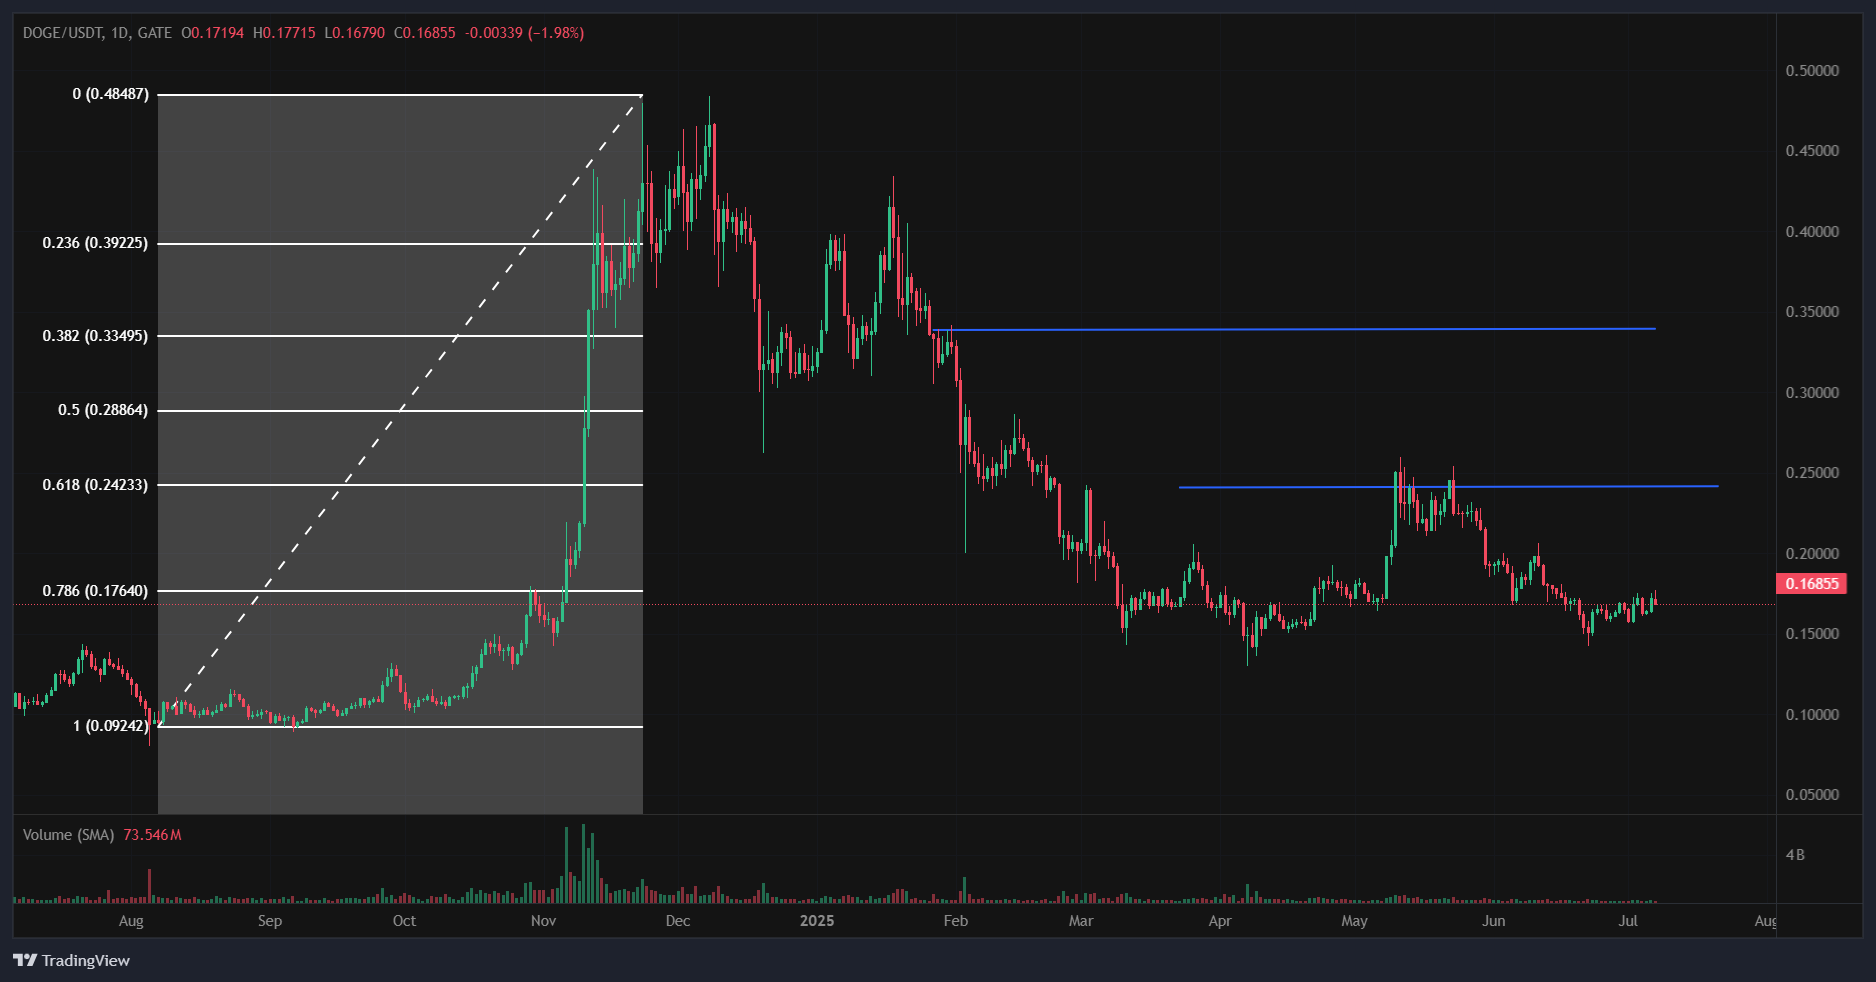
The chart also includes Fibonacci retracement levels, drawn from the Dogecoin price macro low of $0.09242 to the peak of $0.48, last seen back in December 2024. These levels offer a roadmap for identifying critical zones of support and resistance. At present, Dogecoin price is trading just below the 0.786 Fibonacci level at $0.17640, which now serves as immediate resistance.
Further resistance is aligned with the neckline of the double bottom at $0.2596, which is close to the 0.618 Fibonacci level at $0.24233. Should the price break above this range, subsequent upside targets could include the 0.5 Fib level at $0.28864 and the 0.382 Fib level at $0.33495, both of which are situated along the path of Dogecoin’s previous major rally.
According to Tucker, as long as the Dogecoin price holds above the key support at $0.1467, the setup remains intact and the target of $0.2596 stays open. From the current price of $0.1681, this would require a rally of approximately 54.45%.
URPD Chart Highlights Key Supply Zones
Meanwhile, an important on-chain signal supporting the technical outlook comes from the UTXO Realized Price Distribution chart by Glassnode. This chart highlights price levels where large volumes of DOGE last moved, identifying key resistance zones where holders may sell.
Notable clusters appear at $0.1774, $0.2069, and $0.3622, levels that align with resistance areas flagged by analyst Ali Martinez.
Keep an eye on these three key resistance levels for Dogecoin $DOGE: $0.18, $0.21, and $0.36! pic.twitter.com/0Y84cCmlx2
— Ali (@ali_charts) July 7, 2025
These zones could create selling pressure as the price approaches them. The largest accumulation sits at $0.0739, where 20.03% of DOGE supply was acquired, but more immediate resistance is at $0.177 (8.94% of supply) and $0.2069 (7.24%).
A successful break above $0.21 could clear the way toward higher targets like $0.36, where another 3.82% of DOGE was last transacted.
DisClamier: This content is informational and should not be considered financial advice. The views expressed in this article may include the author's personal opinions and do not reflect The Crypto Basic opinion. Readers are encouraged to do thorough research before making any investment decisions. The Crypto Basic is not responsible for any financial losses.