




Bitcoin’s Current Range Mirrors a Key 2023 Structure as $70K–$90K Levels Come Into Focus.
Bitcoin’s long-term chart shows a recurring sequence of rally, consolidation, downside liquidity sweep, and renewed expansion. The current structure is developing between roughly $60,000 and $84,000, following the decline from the chart’s major high near $124,000–$126,000.
The chart also highlights a 2023 structure as a historical comparison. The price levels and sequence are similar in form, although the present structure is occurring at substantially higher nominal BTC prices.
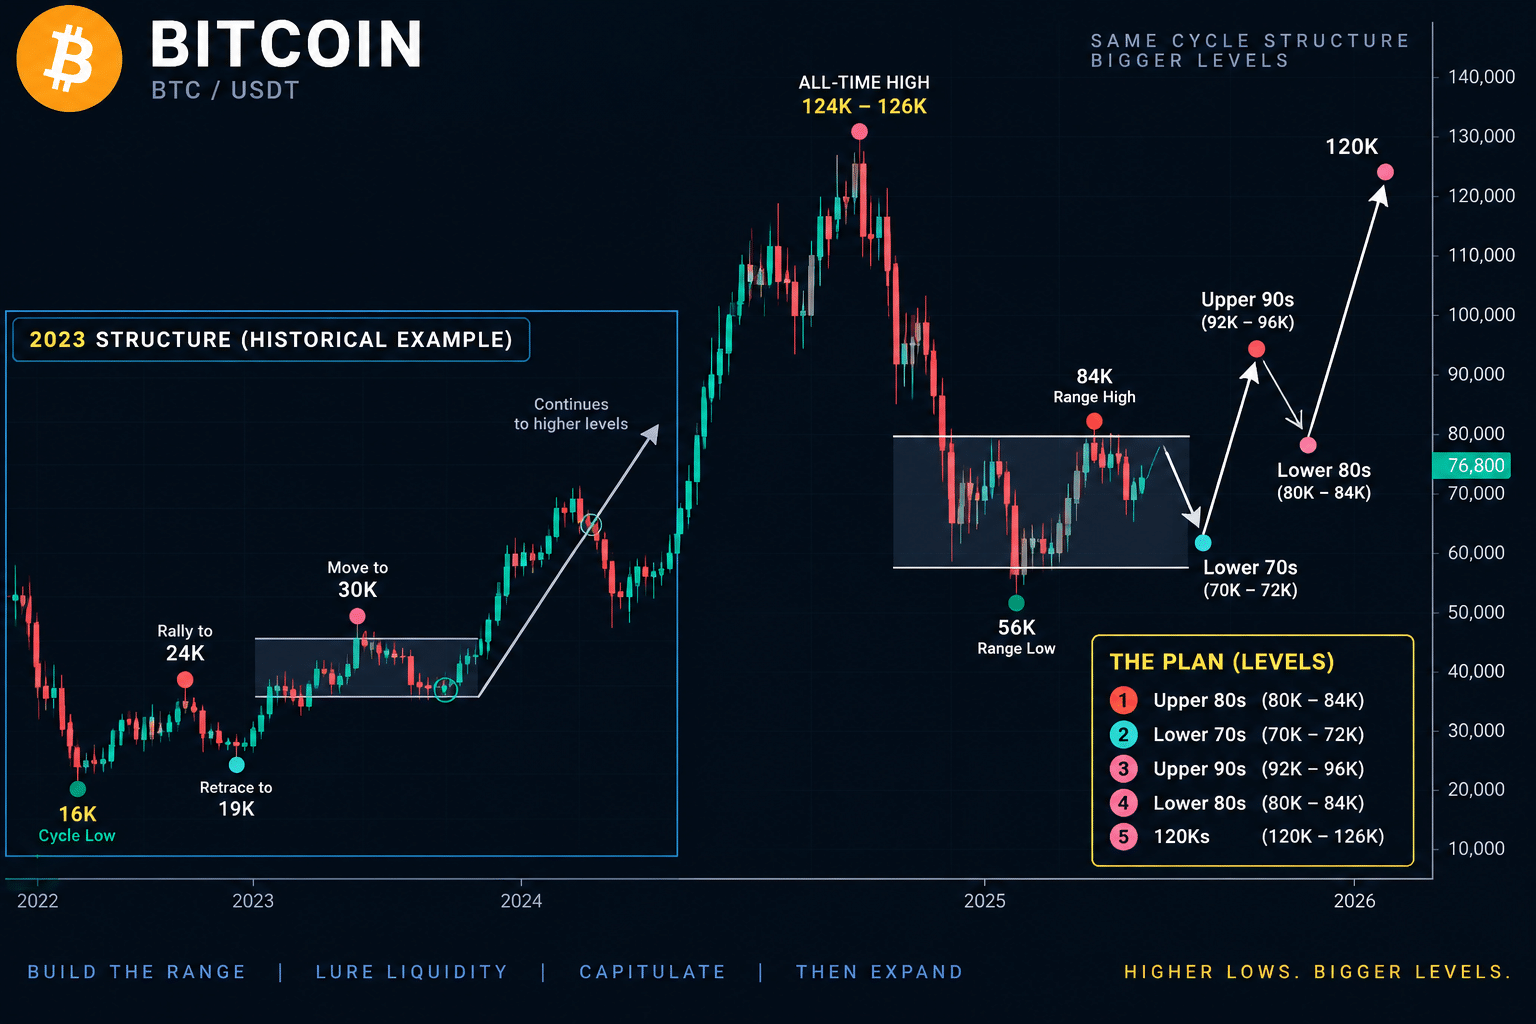
Bitcoin’s 2023 Structure
The earlier section begins with Bitcoin bottoming around $16,000 following a prolonged decline. BTC subsequently recovered to approximately $24,000, establishing the first major rebound from the cycle low.
Price then advanced toward roughly $30,000–$31,000, but that move did not immediately produce sustained continuation. BTC moved back toward the mid-$20,000s before the larger advance developed.
The chart marks the sequence with colored reference points: a major low near $16,000, a higher reaction low around $18,000–$20,000, a rally toward $30,000, and another pullback into approximately $24,000–$25,000. The following expansion carried Bitcoin through $30,000 and eventually toward the $60,000–$70,000 region.
The Current Bitcoin Range
The right side shows a comparable price sequence at a larger scale.
After reaching approximately $124,000–$126,000, Bitcoin entered a steep decline. The first major downswing reached the mid-$60,000s, followed by a rebound toward approximately $80,000–$82,000.
BTC then returned to the low-$60,000 region, with the deepest wick on the chart extending toward roughly $56,000. From that low, price recovered rapidly back into the upper-$70,000 area.
The latest candles are positioned around $76,000–$78,000.
$70K–$84K Defines the Immediate Structure
The chart identifies several levels around the current range. The low-$70,000 area sits below the current price and represents the next major zone inside the broader structure. Above price, approximately $84,000 forms the next marked level, followed by the mid-$90,000s.
The projected sequence displayed on the chart is:
Upper $80Ks → lower $70Ks → upper $90Ks → lower $80Ks → $120Ks.
These are projected levels shown by the chart, not completed price movements.
A move into the lower $70,000s would still remain well above the chart’s approximately $56,000 reaction low, meaning it would constitute a higher low relative to that wick.
A Range-High Deviation Is Also Shown
The 2023 comparison contains another notable feature: price moved above a local range before subsequently retracing.
Applied to the current structure, the equivalent sequence would involve BTC first moving toward or through the $80,000–$84,000 range highs, followed by a return toward the lower part of the range.
From a liquidity-structure perspective, this would create price activity on both sides of the established range before a directional break.
Latest Five Candles Show Strong Rebound Followed by Compression
The five most recent candles show a sharp transition from selling to recovery.
The sequence begins around the $63,000–$65,000 region, followed by a large bullish expansion candle that pushes BTC rapidly into approximately $77,000–$80,000. The next candles have considerably smaller real bodies around the upper-$70,000s.
Upper wicks near $80,000–$82,000 show that price has traded above the recent closes but has not maintained those intraperiod highs. At the same time, the latest bodies remain well above the previous $60,000–$65,000 consolidation.
This produces a clear short-term structure: strong rebound followed by price compression beneath the $80,000–$84,000 area.
Wyckoff Structure: Range Development After Markdown
The decline from approximately $124,000 to the $56,000–$64,000 region represents the chart’s markdown phase. The subsequent sideways movement between the low-$60,000s and low-$80,000s is consistent with a developing trading range.
Within Wyckoff terminology, the current structure is therefore closer to range development/testing following markdown than an established markup phase.
The chart does not display volume, so volume-based Wyckoff confirmation cannot be measured from this image.
The principal figures visible in the current structure are $56K–$64K for the established lower extreme, $70K–$72K as the highlighted higher-low region, $80K–$84K around the current upper range, the upper $90Ks as the next projected expansion area, and the $120K region as the final projected level shown on the chart.