




Cardano (ADA) price is showing a bullish chart pattern that points to the potential for another major rally, according to TradingView analyst Akbar Karimzsfeh.
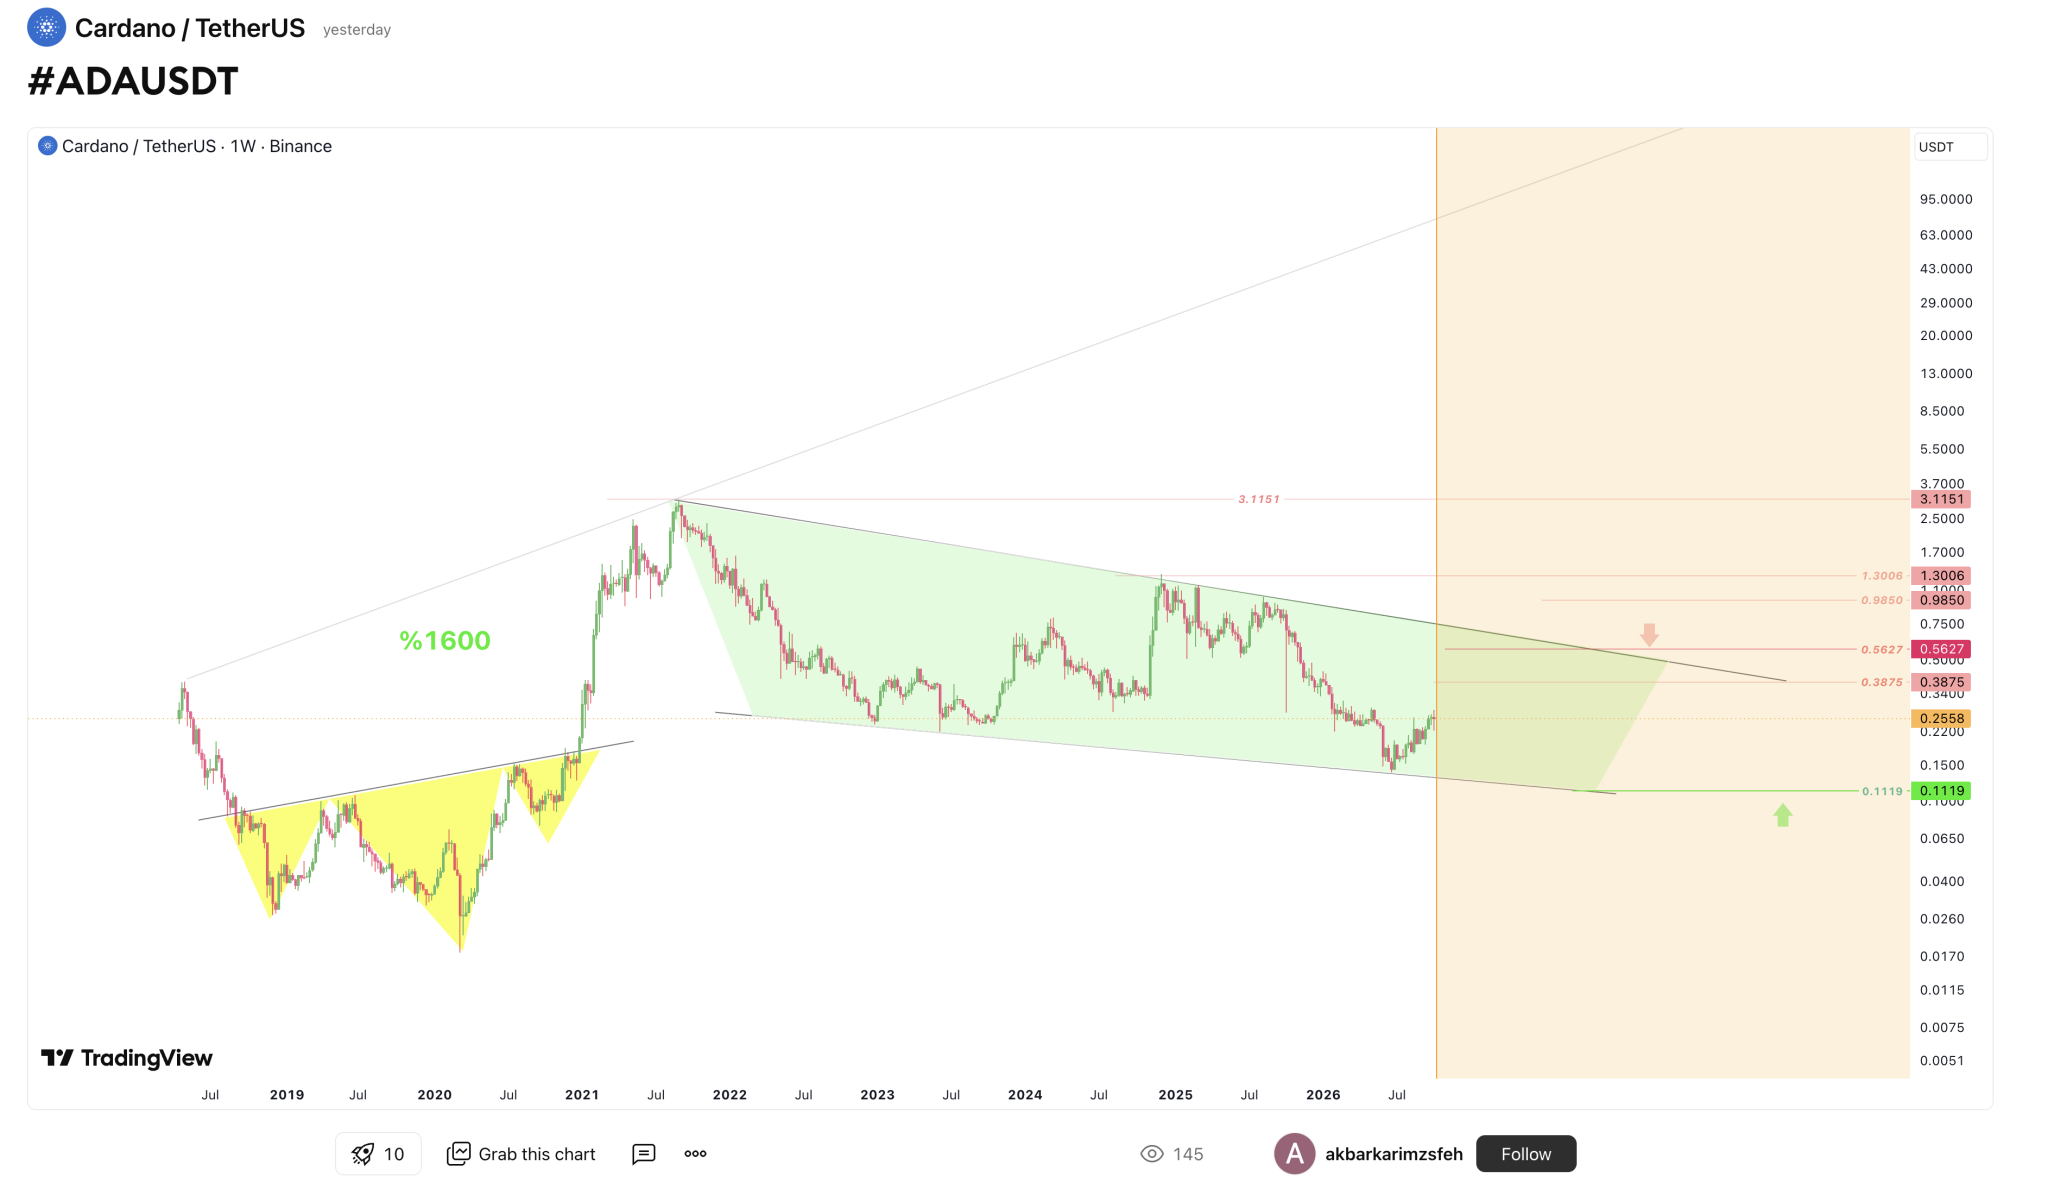
The analyst highlighted a large green pattern on ADA’s weekly chart, with the price moving within its boundaries ahead of a potential breakout above the upper trendline.
The setup follows an earlier inverse head-and-shoulders pattern that preceded a rally of approximately 1,600%.
Karimzsfeh sees another major rally on the horizon if ADA breaks above its current pattern. He also identified the lower boundary as a critical support level that will determine whether the bullish outlook remains intact.
ADA Remains in a Long-Term Downtrend
Cardano (ADA) continues to trade within a descending channel established after its 2021 peak. The pattern features a downward-sloping upper boundary and a lower boundary serving as a key support zone.
At the time of the chart, ADA was trading around $0.2558, well below its previous highs and still confined within the descending channel. A bullish breakout puts $0.3875 and $0.5627 as key upside targets. These levels represent important price milestones for ADA as it attempts to reverse its long-term downtrend.
ADA remains under pressure until the price breaks above the channel’s upper boundary. Continued trading within the channel keeps the broader bearish structure intact.
Break Below Support Would Weaken the Bullish Outlook
Meanwhile, Karimzsfeh identified the pattern’s lower boundary at $0.1119 as a critical level. A breakdown below this support would invalidate the bullish setup and signal further downside risk.
For now, ADA needs to hold within the pattern before mounting a decisive breakout above its upper boundary. A successful breakout would strengthen the recovery outlook, while a breakdown below support would undermine the bullish case.
The previous pattern preceded a 1,600% rally, giving bulls a compelling historical reference point. However, ADA must first clear its current pattern’s upper boundary to confirm the breakout and establish the foundation for another major upward move.
Notably, the coin has surged by 101% from $0.137 to $0.2823 before retracing slightly to $0.223. Meanwhile, the bulls are regaining strength, with Cardano surging by 8% over the last 24 hours.
Setup Similar to 2023’s 200% Rally
Separately, Crypto Crew University argues that ADA’s price is forming a technical setup similar to the one that preceded its nearly 200% rally in 2023. He highlighted ADA’s monthly RSI approaching its moving average, where a crossover above the average would signal a buying opportunity, while Fibonacci Moving Average (FibMA) bands could help identify exit targets.
In 2023, Cardano climbed from around $0.23 in June to $0.81 in March 2024, a gain of roughly 250%, despite the absence of a major altcoin season.
ADA is currently trading near $0.2528, with its RSI approaching the key moving average. However, the bullish signal remains unconfirmed. If ADA repeats its previous rally, it could reach approximately $0.88.