




The XRP Heikin Ashi chart is showing a pattern that resembles the one that appeared before XRP major rally in 2017.
On the 3-day chart, XRP has formed 11 consecutive red candles since late September, with the decline continuing through most of October.
However, a potential green candle has started to form as of press time, and this has raised the possibility that the downtrend could be losing strength.
Historical Data on XRP Heikin Ashi Trend
A similar pattern appeared on the same chart in March 2017. At the time, a green candle followed an extended run of red candles before XRP began a rally that eventually took its price from $0.006 to $3.31 by January 2018.
This move represented a gain of approximately 55,000%. Market analyst EGRAG Crypto has compared the current chart with the 2017–2018 price movement, highlighting the similarities between the two formations.
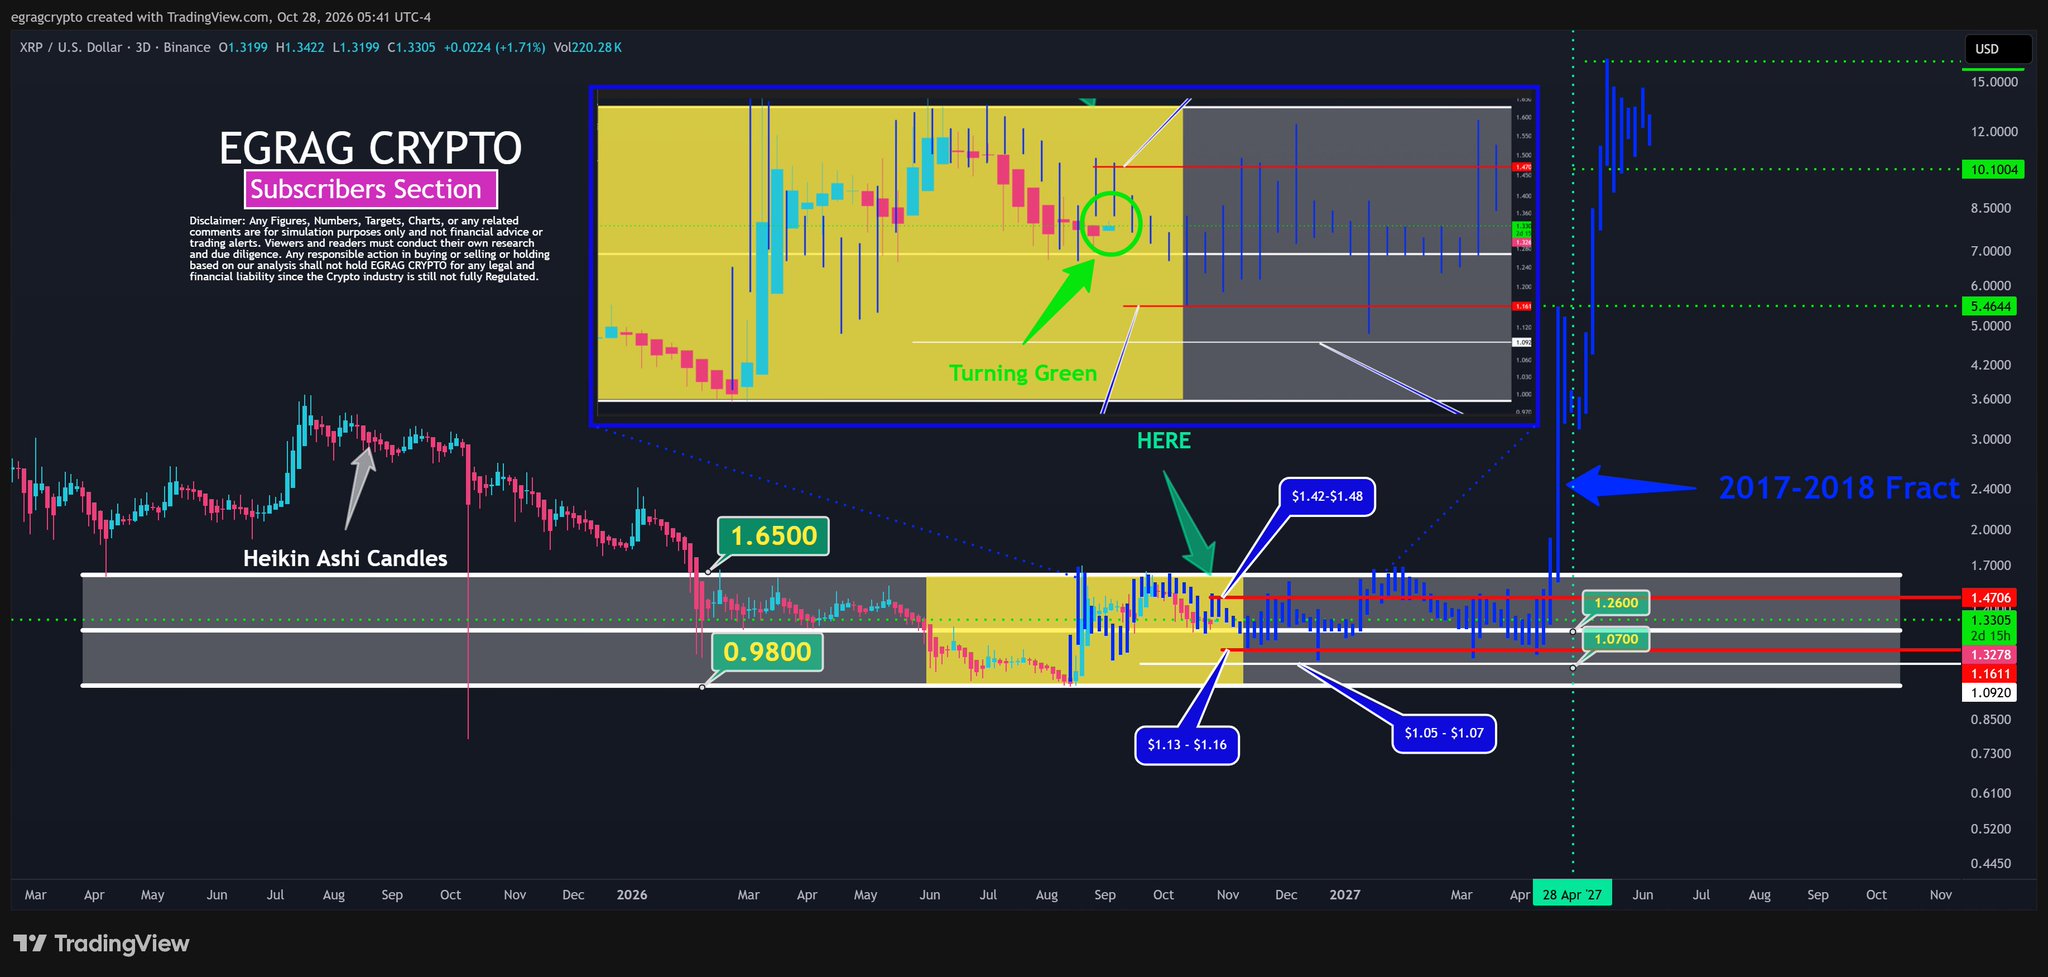
Although the patterns look similar, that doesn’t mean XRP will repeat its previous rally. The current three-day candle must close green before traders can confirm that the chart has produced a potential reversal signal.
What the XRP Heikin Ashi Pattern Means
For the uninitiated, Heikin Ashi is a charting method that uses averages based on current and previous price data to reduce short-term price movements and make the main trend easier to follow.
Unlike regular candlesticks, Heikin Ashi candles retain the same color during sustained upward or downward moves. As a result, a change from red to green can indicate a possible shift in market momentum.
XRP’s 11 consecutive red candles show the selling pressure that has weighed on its price since late September.
However, the current active candle is on the verge of flipping this trend. The candle opened at $1.3199 and reached an intraday high of $1.3422. At the time of writing, XRP traded at $1.3305, representing a 1.71% gain.
The potential green candle is the first sign of a break in the bearish sequence in more than a month, resembling the March 2017 reversal candle. However, the current candle has yet to close, so the market still needs to confirm the change in direction.
October Weakness Could Set the Stage for a Recovery
XRP’s recent decline has come during a month that has historically been difficult for the cryptocurrency. October has recorded an average XRP price decline of 19.6%, making it the asset’s weakest calendar month by this measure.
This year, seasonal pressure has coincided with a hotter-than-expected September Consumer Price Index (CPI) report, which increased concerns about possible Federal Reserve rate hikes and put further pressure on risk assets.
EGRAG Crypto sees the October decline as a possible market shakeout within a recurring seasonal pattern. This outlook suggests the weakness could give way to stronger price action in November, followed by further gains in December.
Several analysts have identified $1.30 as an important support level for XRP throughout 2026, and the current Heikin Ashi pattern is developing around this price zone. However, XRP will need enough buying demand to hold this level and support a sustained recovery.
XRP Heikin Ashi Support Levels
If the current three-day candle closes green, XRP could begin recovering toward $1.48-$1.50. Before reaching that range, the price must overcome resistance between $1.42 and $1.48.
A break above this zone would bolster the case for a continued recovery, although it would not guarantee a repeat of the 2017 rally.
There is also the possibility that XRP could fall further before establishing a stronger base for a recovery. The price could revisit $1.13-$1.16 or decline to $1.05-$1.07. These lower levels could attract renewed buying interest and help form a second bottom.