


Binance Coin (BNB) hovers above the $637 support level amid growing bearish pressure. Can it bounce back, or is a dip to $600 inevitable?
Amid broader market uncertainty, BNB maintains a declining trend, risking a potential breakdown of this crucial support level. Will such a breakdown push Binance Coin’s price down to the $600 psychological support?
Binance Coin Price Analysis
On the daily chart, Binance Coin trades sideways just above the $637 support level. However, price action shows high volatility, with consolidation topping near $698.
At present, Binance Coin trades at $644, with a third potential bearish candle forming. As the downward trend gains momentum amid broader market uncertainty, the risk of breaking below the $637 support level increases.
-

Binance Coin price chart
Supporting this downside risk, momentum indicators signal a surge in selling pressure. The MACD and signal lines have plunged into negative territory. Furthermore, the daily RSI is below the midpoint, reflecting weakening bullish momentum.
As the chances of a decline increase, price action suggests the $600 psychological level as the next crucial support. However, a potential bounce-back remains possible, as indicated by the long wicks—represented by long-tailed candles—forming near the support level, though this support appears fragile.
A potential reversal in Binance Coin could test the monthly high at $673.
BNB Derivatives Signal Increased Fear
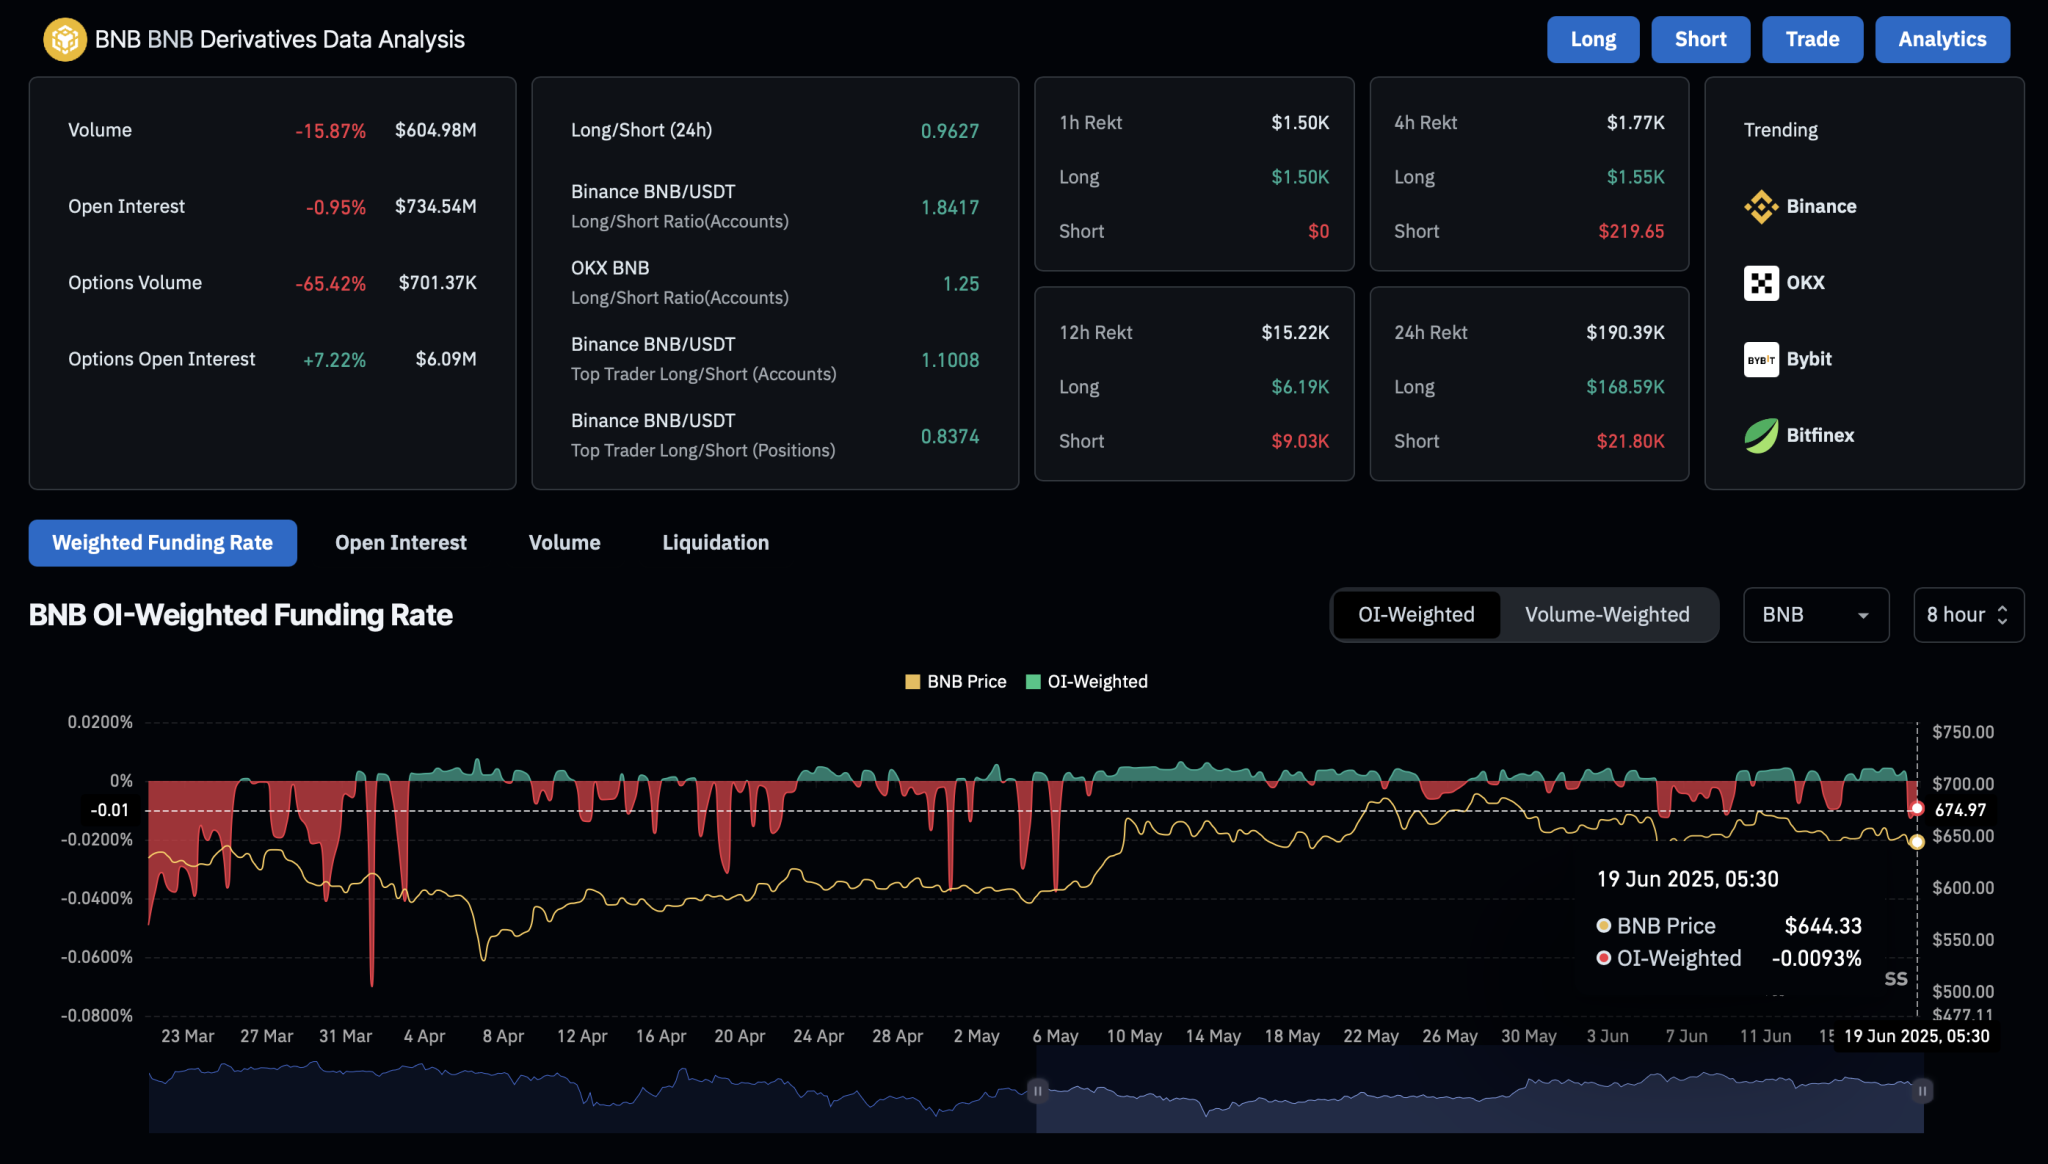
The derivatives market presents mixed signals as Binance Coin stands at a crossroads. Open interest is down 0.95%, reaching $734 million. Long liquidations have surged to $168K in the past 24 hours. This represents a significant wipeout of bullish traders compared to short liquidations of just $21,800.
Due to the larger wipeout of bullish traders, the long-to-short ratio at 0.9627 indicates more active bearish positions. Trader activity has taken a bearish turn, as the overweight funding rate drops to -0.0093%.
-
BNB Derivatives