

As Bitcoin maintains its rebound push, market analysts are now eyeing a new all-time high at the 1.618 Fibonacci extension.
Specifically, market watcher Jake Wu points out that Bitcoin is moving toward the 1.618 Fibonacci extension at $130,558, a target mapped from the January–April 2025 measured move. This comes as the firstborn crypto recently went slightly above $119,000.
Data from his chart shows that this Fibonacci projection is derived from the rally that began after Bitcoin’s August 2024 pivot, when the price bottomed near $60,000 before resuming its upward trajectory. The January to April 2025 rally lifted Bitcoin from roughly $75,000 to $118,000, marking a gain of more than 57%.
Following that leg, the market consolidated, with a corrective pullback sending BTC toward the $109,000 support zone in late September. From this low, Bitcoin surged nearly 10% in the first week of this new month, reclaiming $118,991 on October 2.

The volume profile shows a significant volume shelf at $108,000, which provides a structural support zone. This shelf represents an area of high trading activity and has acted as a springboard for the current rally. Notably, sustaining momentum above this level gives the 1.618 extension added weight as the next milestone in the trend.

MVRV Bands Point to $139K Next for BTC: Ali Martinez
Meanwhile, as Bitcoin continues to recover, analyst Ali Martinez is also bullish on its trajectory, stating it could fly to $139,000 based on current market conditions, adding to the long list of Bullish predictions on the crypto king.
He shows that Glassnode’s MVRV Extreme Deviation Pricing Bands also confirm expansion potential. At the current price, Bitcoin has so far broken above the +0.5σ band at $116,733. Historically, this breakout often leads toward the +1σ band, now positioned at $138,816.

The deviation model places strong statistical significance on these zones. Bitcoin’s realized price of $53,931 highlights that the market’s average cost basis remains far below the current spot price. Long-term holders are comfortably in profit, a condition that typically aligns with stronger directional conviction.
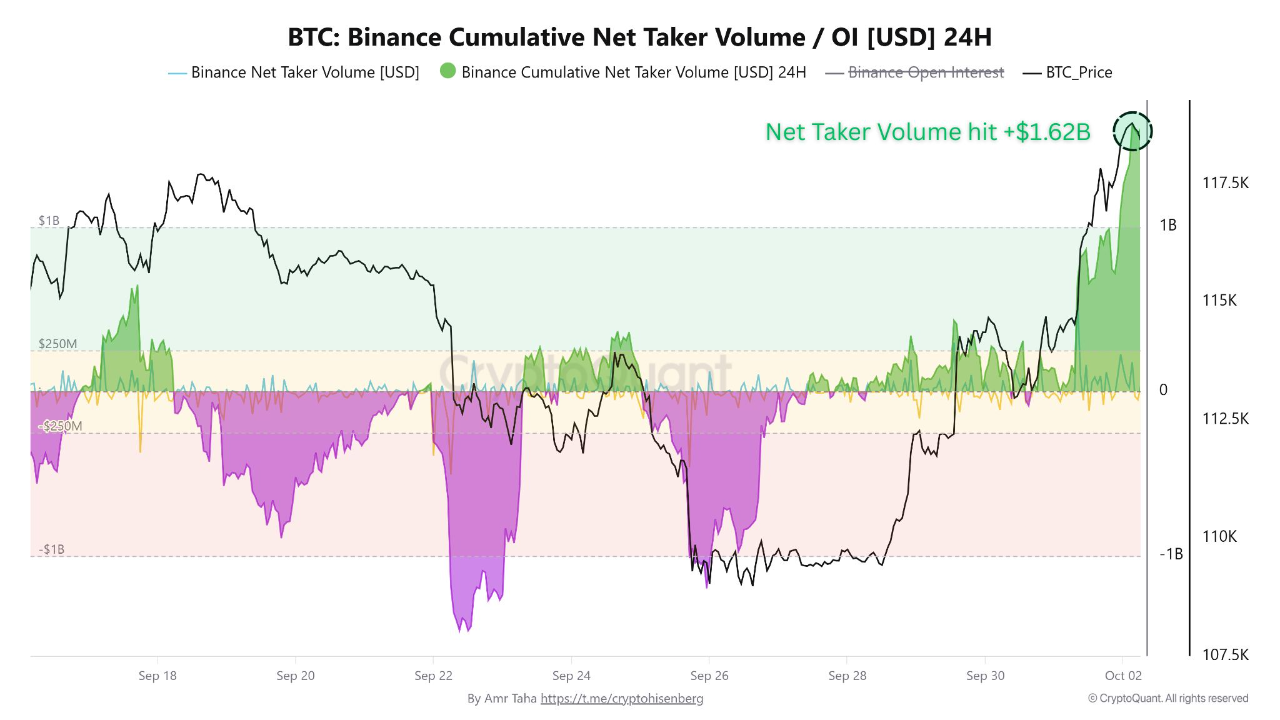
Binance Data Shows Aggressive Buy-Side Pressure
Supporting the move is derivatives market data from Binance. On September 25, Bitcoin fell to a local low near $109,000, which coincided with a -13.5% drop in open interest, signaling heavy position closures. This was effectively a capitulation point, flushing weaker hands from the market.
By October 2, open interest had rebounded +11%, a 24.5% swing within one week. At the same time, Binance net taker volume surged to +$1.62 billion, the strongest positive reading throughout September. This marked a clear dominance of buy orders over sell orders, flipping sentiment from defensive to aggressive accumulation.
The sharp breakout past $119,000 was further accelerated by liquidations. Data shows a significant liquidity cluster at that level, where short positions were forced to cover. As sell orders converted into market buys, upward pressure intensified.
DisClamier: This content is informational and should not be considered financial advice. The views expressed in this article may include the author's personal opinions and do not reflect The Crypto Basic opinion. Readers are encouraged to do thorough research before making any investment decisions. The Crypto Basic is not responsible for any financial losses.