



A bearish formation on the XRP daily chart suggests further correction if prices close below the crucial $2.66 support trendline.
XRP took an unexpected turn on Tuesday, as with major cryptocurrencies. While bulls cheered over Bitcoin’s new all-time high and XRP running above the $3 resistance, profit-taking market users sparked a massive sell-off, dragging prices with it.
Notably, XRP dropped 4.55% on the day, retesting lower levels around $2.85. The downside has now seen the token relinquish most of its “Uptober” gains. Recall that XRP had reached an intra-month high of $3.10. As a result, the current price of $2.854 represents an 8% decline.
Classic Descending Triangle Formation on the XRP Chart
Veteran trader Peter Brandt highlighted this in his Tuesday analysis, suggesting there could be further downsides. Specifically, he identified a descending triangle, as described by Edwards and Magee, taking shape on the daily chart.
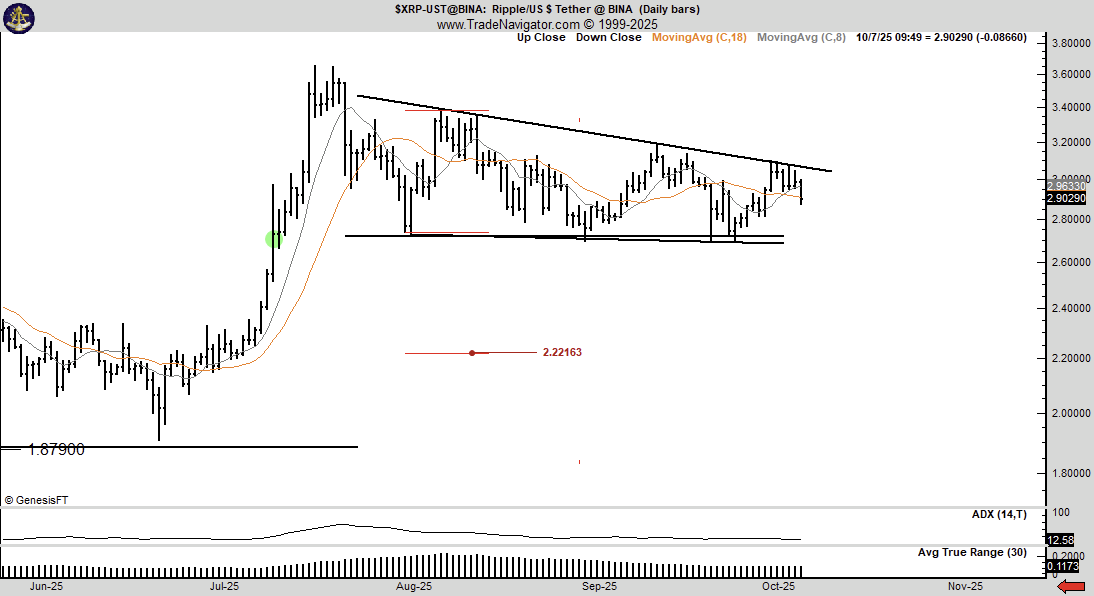
The structure has been forming since XRP experienced strong price rejection from its yearly high of $3.66 in July. The token has since ranged between the upper resistance and lower support of the pattern.
A clear rejection from the October high of $3.10 has sent XRP on a downward spiral, with prices looking weak. Meanwhile, Brandt highlighted that a close below the triangle’s lower support at $2.68 would turn him into “a hater.”
Precisely, he suggested that closing below the support would confirm the bearish pattern, which should catalyze an XRP drop to $2.221. XRP last saw that price level in early July, and this would mark a 22% correction from the current market price.
Aligning Bearish XRP Outlook
Speaking of retests, market veteran Ali Martinez also predicted that XRP could see further lows. He shared an XRP trend within a descending triangle on the daily timeframe with a similar origin as Brandt’s.

However, he projected that XRP could simply retest the bottom of the triangle at $2.72. His chart further highlighted a possible consolidation within the descending triangle, filling the remaining spaces before XRP makes its next breakout.
Nonetheless, other prominent traders suggest XRP would take a bullish turn from within the descending triangle. Professor Astrones, for instance, believes the setup is “pumpy” for XRP, predicting that a breakout would take the token to $5.
The $5 target marks a new all-time high for XRP and also represents a 75% price rally from the current market level. Moreover, Altcoin Moe also has a similar target to XRP.