


XRP is at risk of a downside move, as falling open interest and a possible bear flag pattern point to $1.04 as the next key support level.
XRP continues to show signs of weakening momentum, with both on-chain data and technical indicators pointing to intense selling pressure.
A CryptoQuant analysis reveals declining participation in the derivatives market. At the same time, chart analysis suggests a bearish continuation pattern could send the token toward lower support levels.
XRP Open Interest Drops Lower
CryptoQuant verified author PelinayPA highlighted that XRP’s open interest on Binance has fallen to $350.6 million, one of its lowest readings in recent months. The decline suggests traders are increasingly closing leveraged positions and preferring to stay on the sidelines as interest in derivative exposure to the asset drops.
The open interest across all exchanges has also followed a similar trajectory. At the time of writing, the metric stood at $776 million, reaching lows last seen in February.
Meanwhile, the Network Value to Transactions (NVT) ratio remains elevated at 162.86. High NVT readings generally indicate that network activity has not recovered enough to impact XRP’s valuation. This suggests that activities on the XRP Ledger remain minimal and continue to affect the asset’s recovery negatively.
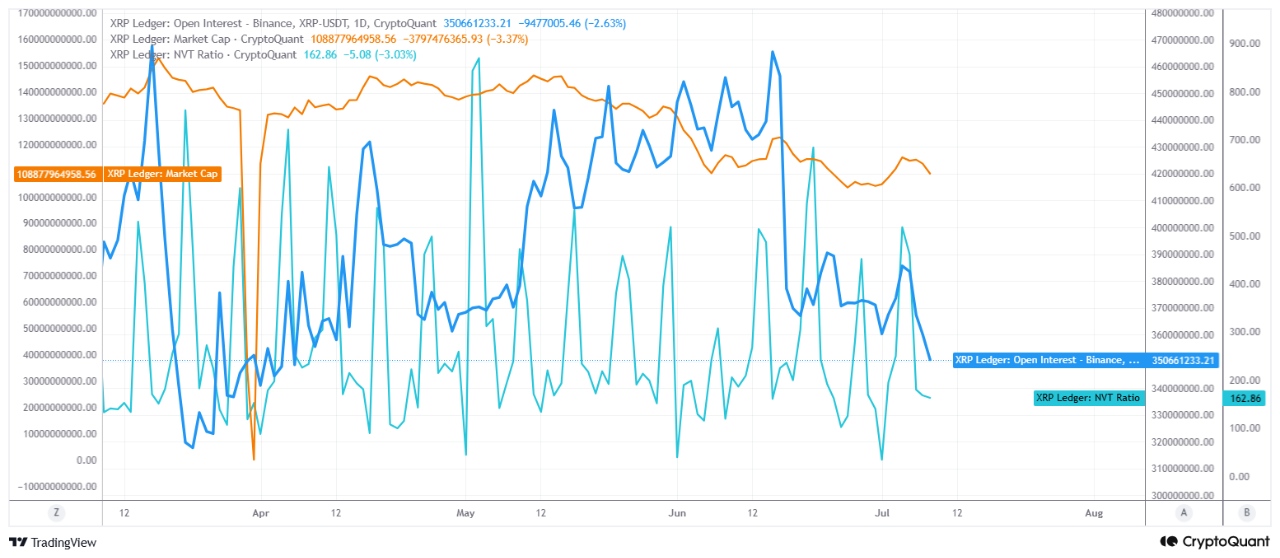
Taken together, the analyst noted that these indicators reflect a market where risk appetite has cooled considerably, leaving sellers with the upper hand. Unless the current condition changes, the XRP price remains vulnerable and could drop further.
Bear Flag Pattern Puts $1.04 in Focus
Meanwhile, a 1-hour chart analysis from Ali Martinez adds to the cautious outlook. In a parallel analysis, he identified a bearish formation that could potentially push XRP lower.
An accompanying chart shows that after a sharp decline, XRP has been consolidating inside what appears to be a bear flag. Its price is compressing between the structure’s upper resistance and the ascending support trendline below.

Notably, this type of pattern often represents a pause after an extended downtrend rather than the beginning of a sustained recovery. Prices make higher lows but are unable to break above a horizontal resistance level. Eventually, a breakdown occurs, starting the next leg down.
Martinez suggested that if this is a flag pattern, then XRP is at risk of further downsides. The flag breaking down could start a measured move toward $1.04, a 5% drop from the current market price of $1.10.