



XRP Repeats Historical Bull-Trap Structure as Weekly Price Tests $1.70.
The Crypto Basic found that XRP’s weekly structure is repeating a sequence visible in two earlier market cycles: major decline, aggressive rebound, failed recovery, extended range, and finally a durable base before the next large expansion.
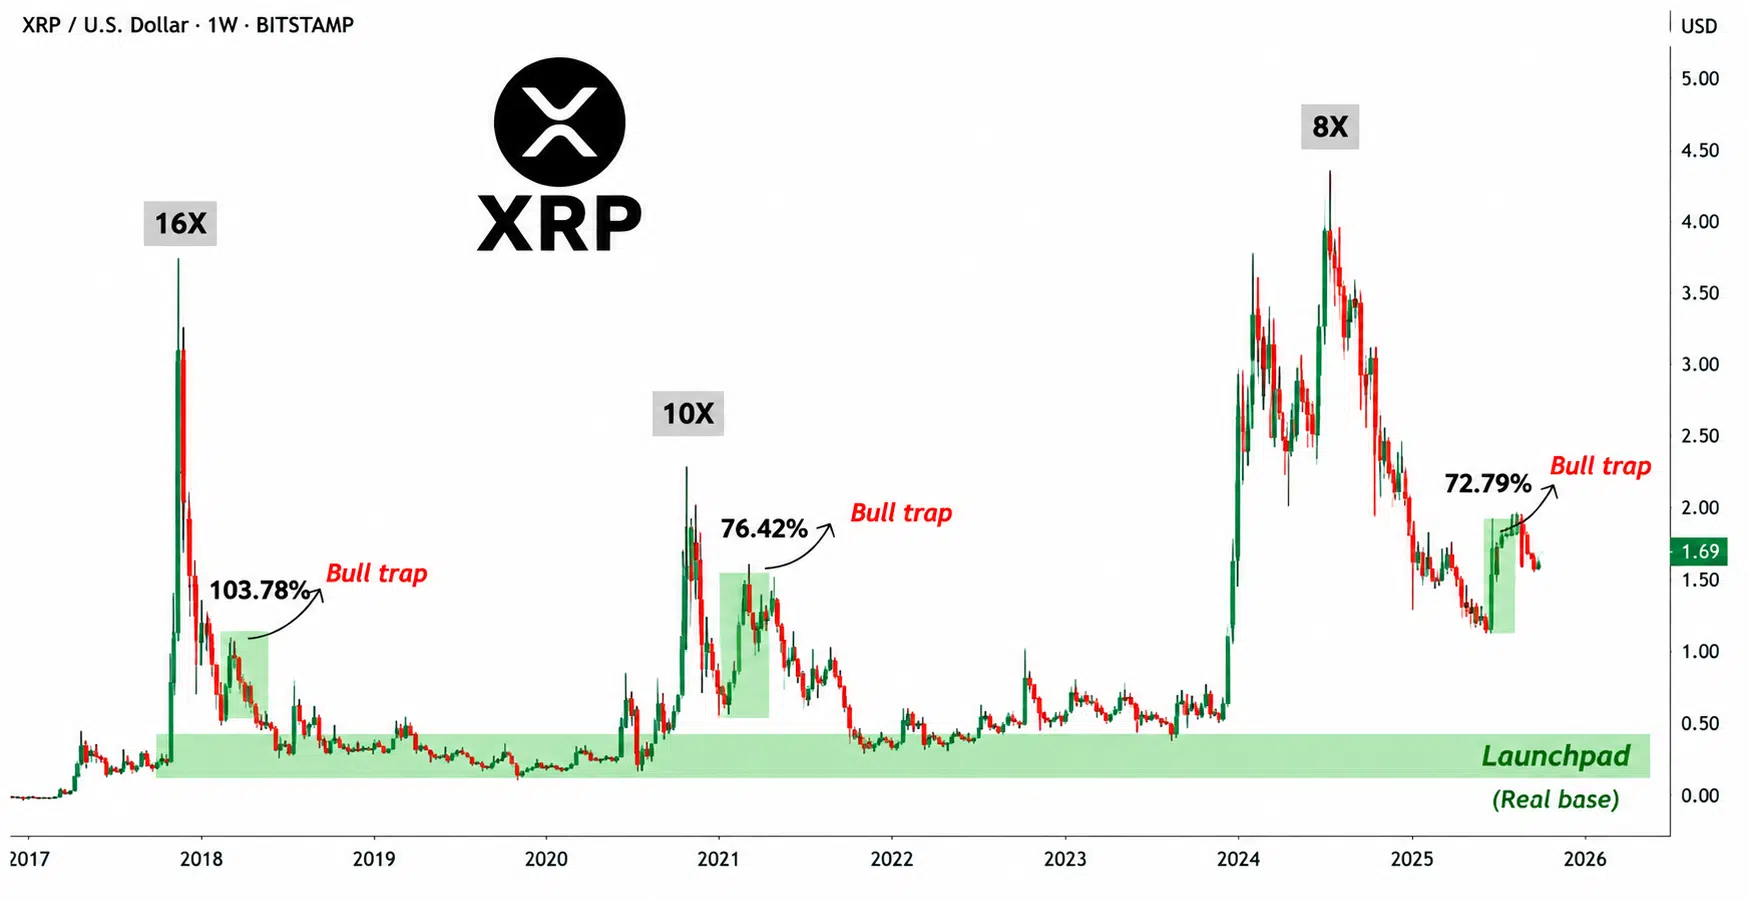
The important point in the current chart is that the $0.98 low should not automatically be classified as XRP’s final cycle base. Based on the historical structure, XRP is still in the rebound/testing portion of the cycle.
What the Previous XRP Cycles Show
In the first historical sequence, XRP recorded an approximately 103.78% rebound following its initial decline. That recovery did not develop directly into a sustained markup. Price rolled over and eventually entered a much longer consolidation around $0.20–$0.40.
That lower range became the more important structural base. The subsequent expansion produced the chart’s approximately 16x advance.
The second sequence followed a comparable pattern. XRP initially recovered approximately 76.42%, but that rebound also failed to establish a sustained uptrend. XRP Price returned toward a lower trading range and spent considerable time building a base.
Only after that consolidation was completed did the larger expansion occur, producing the approximately 10x move highlighted on the chart.
XRP Is Currently in the Middle of the Sequence
The present cycle began with XRP falling from above $3 toward approximately $0.98.
From $0.98, XRP then rebounded approximately 72.79%, carrying the weekly price toward $1.69–$1.70.
The percentage is notable because the current 72.79% rebound is already approaching the magnitude of the previous 76.42% recovery. Both are substantially below the earlier 103.78% rebound, but all three demonstrate that XRP can produce very large countertrend advances before a longer-term base is established.
The Crypto basic reading of the structure therefore places XRP in the post-markdown rebound/testing stage, not yet in a confirmed long-term markup.
Has the Real XRP Base Formed?
Not on this chart yet.
The $0.98 wick represents the lowest point of the latest decline, but a low and a completed base are different structures.
In both previous examples, XRP first bounced sharply from a low. The market then returned to a prolonged range where repeated price tests established the area that eventually became the launchpad for the next expansion.
The current structure has completed the first two parts:
Decline to $0.98 → 72.79% rebound toward $1.70.
What is still missing is the prolonged stabilization and retesting phase visible after the previous bull-trap rebounds.
Wyckoff Cycle Reading
The move from the 2025 high above $3 toward $0.98 represents the chart’s markdown phase. The rebound from $0.98 toward $1.70 is the subsequent recovery.
At present, we would classify XRP as transitioning from late markdown into an early potential accumulation/trading-range process. There is not enough price structure on the chart to classify it as established markup.
The latest $1.69–$1.70 region is therefore the critical structural test on this chart. A rejection would make the present sequence resemble the previous failed rebounds more closely. Sustained weekly acceptance beyond this region would instead separate the current structure from those historical bull-trap examples.
Because the chart contains no volume panel, this classification is based entirely on weekly price structure rather than volume confirmation.