


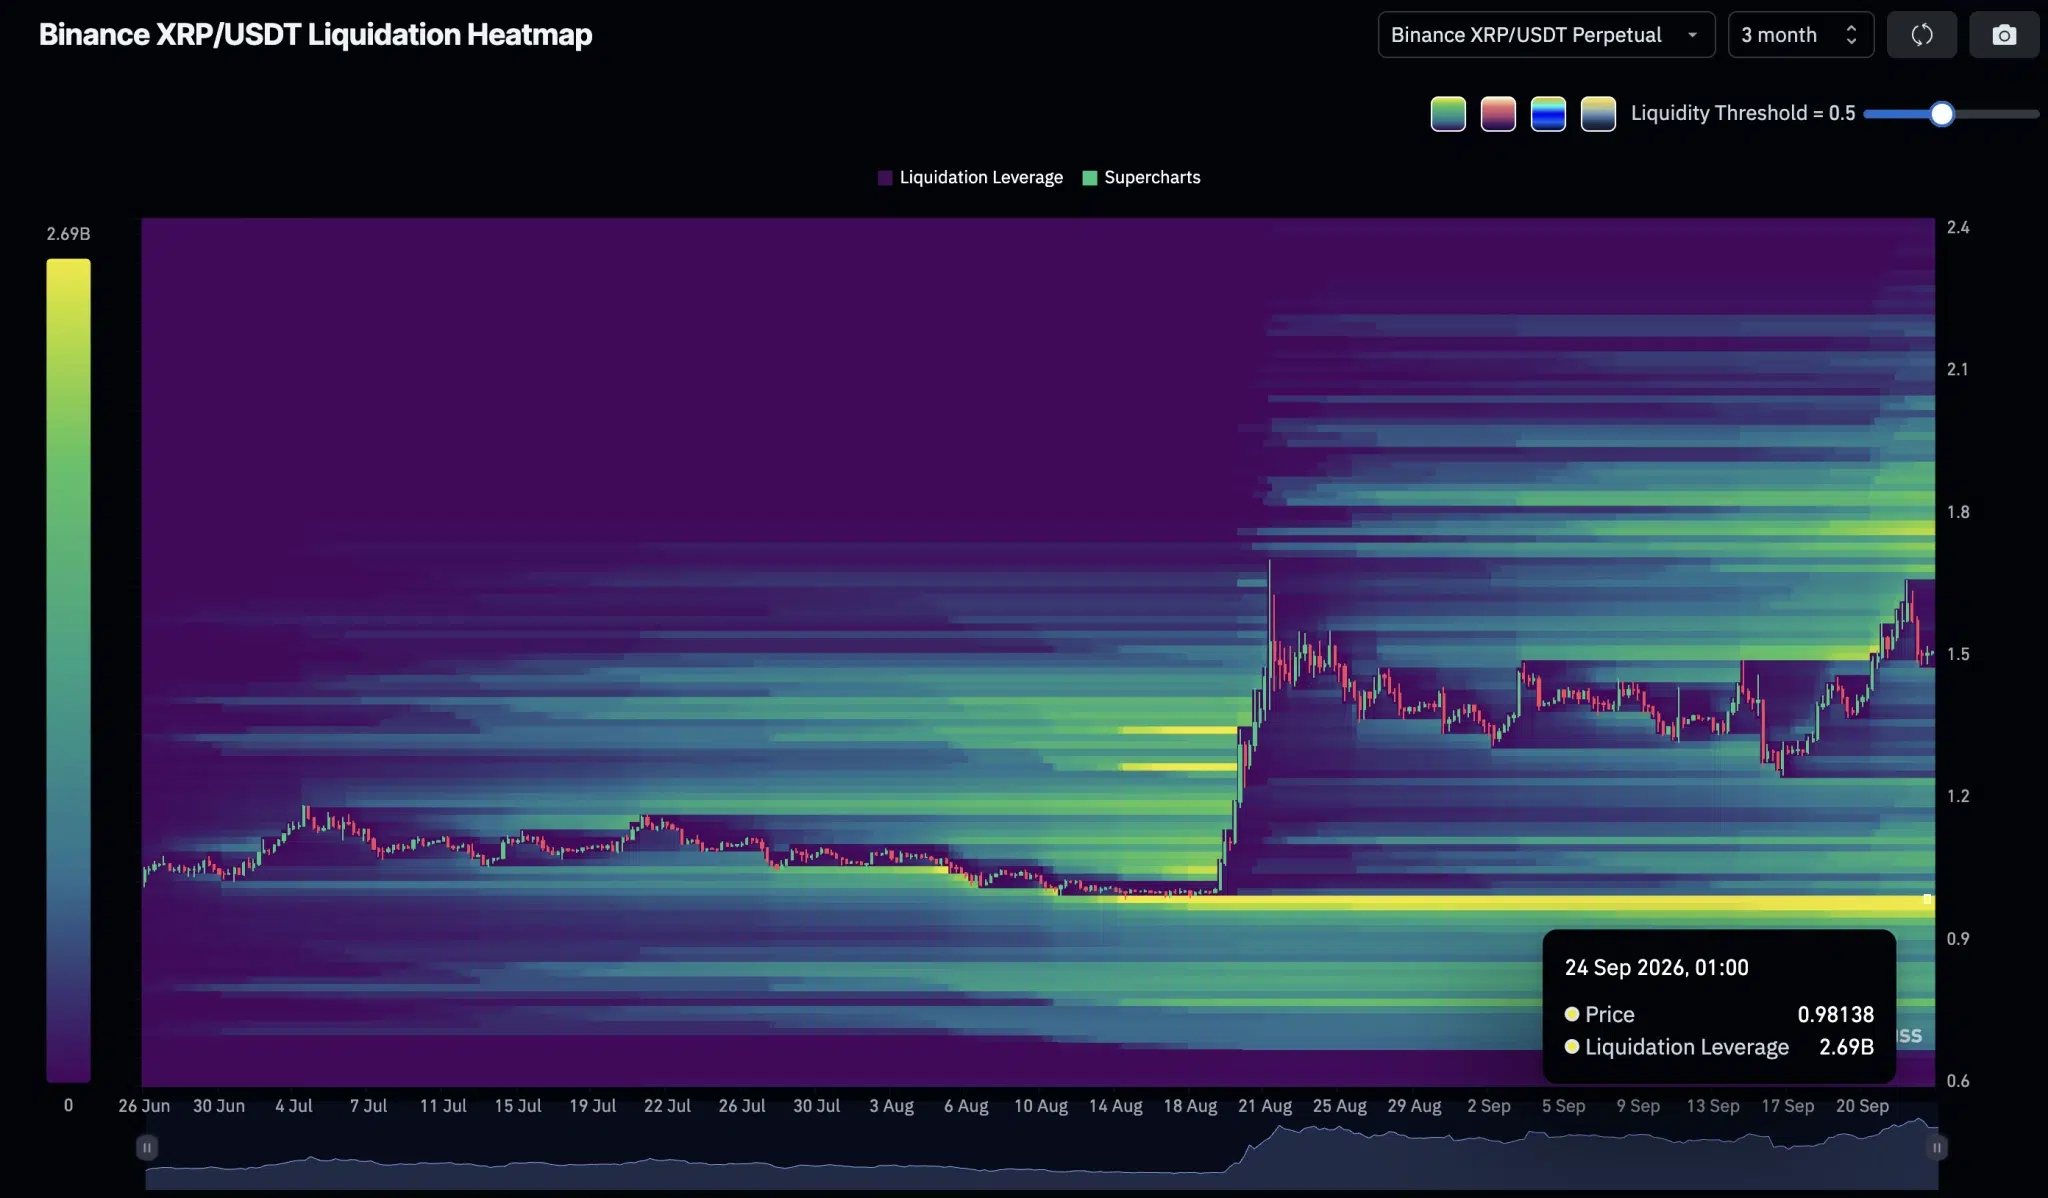
XRP is facing a liquidity test in its ongoing bull run, with a $2.7 billion leverage pocket around $1.00 on the XRP/USDT three-month liquidation heatmap.
Notably, CoinGlass data shows that buying pressure remains around $1.80 and $2.00. However, the massive liquidation zone below $1 increases the risk of another substantial price decline. At the time of writing, XRP was trading near $1.50, down 7.4% over the previous 24 hours.
$1 Liquidity Zone Remains Concerning
Analyst ChartNerd flagged the setup weeks earlier. He identified significant liquidity around $1.50 and $1.80, with an even larger concentration near $0.98.
At the time, XRP had high open interest and heavy leverage, creating conditions in which a major price move could force leveraged traders to close their positions.
In his latest update, ChartNerd cited CoinGlass data showing that the massive liquidity zone at $1 remains in place despite XRP’s recent price recovery.
Meanwhile, ChartNerd stressed that the presence of liquidity at $1 does not guarantee a move to that level. Price does not always reach every liquidity zone, although major liquidity concentrations often become targets during heightened volatility.
He also pointed out that XRP had already reached the $1 area before its previous surge toward $1.70, reducing the significance of another visit as a fresh downside signal. Even so, the large liquidity cluster around $1 remains an important level to watch.
XRP Still Has Room to Reach $1.80 or $2
ChartNerd expects XRP to make a strong price move before the market settles into its next direction. He described the current setup as a “liquidity hunt.”
The three-month chart shows substantial liquidity around $1.80 and $2.00 above XRP, although these zones are smaller than the $2.7 billion sitting near $0.98. XRP is therefore positioned between significant liquidity zones on both sides.
The token has also experienced extreme volatility in recent weeks. XRP moved toward $1.70 in August, plunged near $1.20 this month, and then recovered toward $1.65 this week. ChartNerd also noted that XRP is struggling around its 50-week EMA, which adds another technical hurdle to the current setup.
XRP Previously Bounced Strongly From $0.98
Meanwhile, XRP has already demonstrated the strength of the $1 area. In August, XRP dropped to roughly $0.978 before nearly doubling to about $1.70 just days later. The move shows that a return to $1 does not automatically lead to a prolonged downtrend.
Commenting on the chart, trader Rizznaut said he expects XRP to revisit lower levels before making a large price move higher. He also said the growing liquidity below XRP is influencing his trading decisions.
ChartNerd responded that there are “no guarantees”. He emphasized that the liquidity at $1 is an important level to monitor, rather than a prediction that XRP will reach it. He added that XRP remains trapped within a relatively tight range. Once the range breaks, the resulting move is likely to be sharp in either direction.
Aye. No guarantees. Just important context to add into the mix while we battle the 50 week EMA and have $1.80 resistance ahead! 😀
— 🇬🇧 ChartNerd 📊 (@ChartNerdTA) September 23, 2026