




XRP’s weekly chart shows a right-angled broadening wedge, with $0.95-$1 support and $3.40 resistance defining the structure before higher levels can come into play.
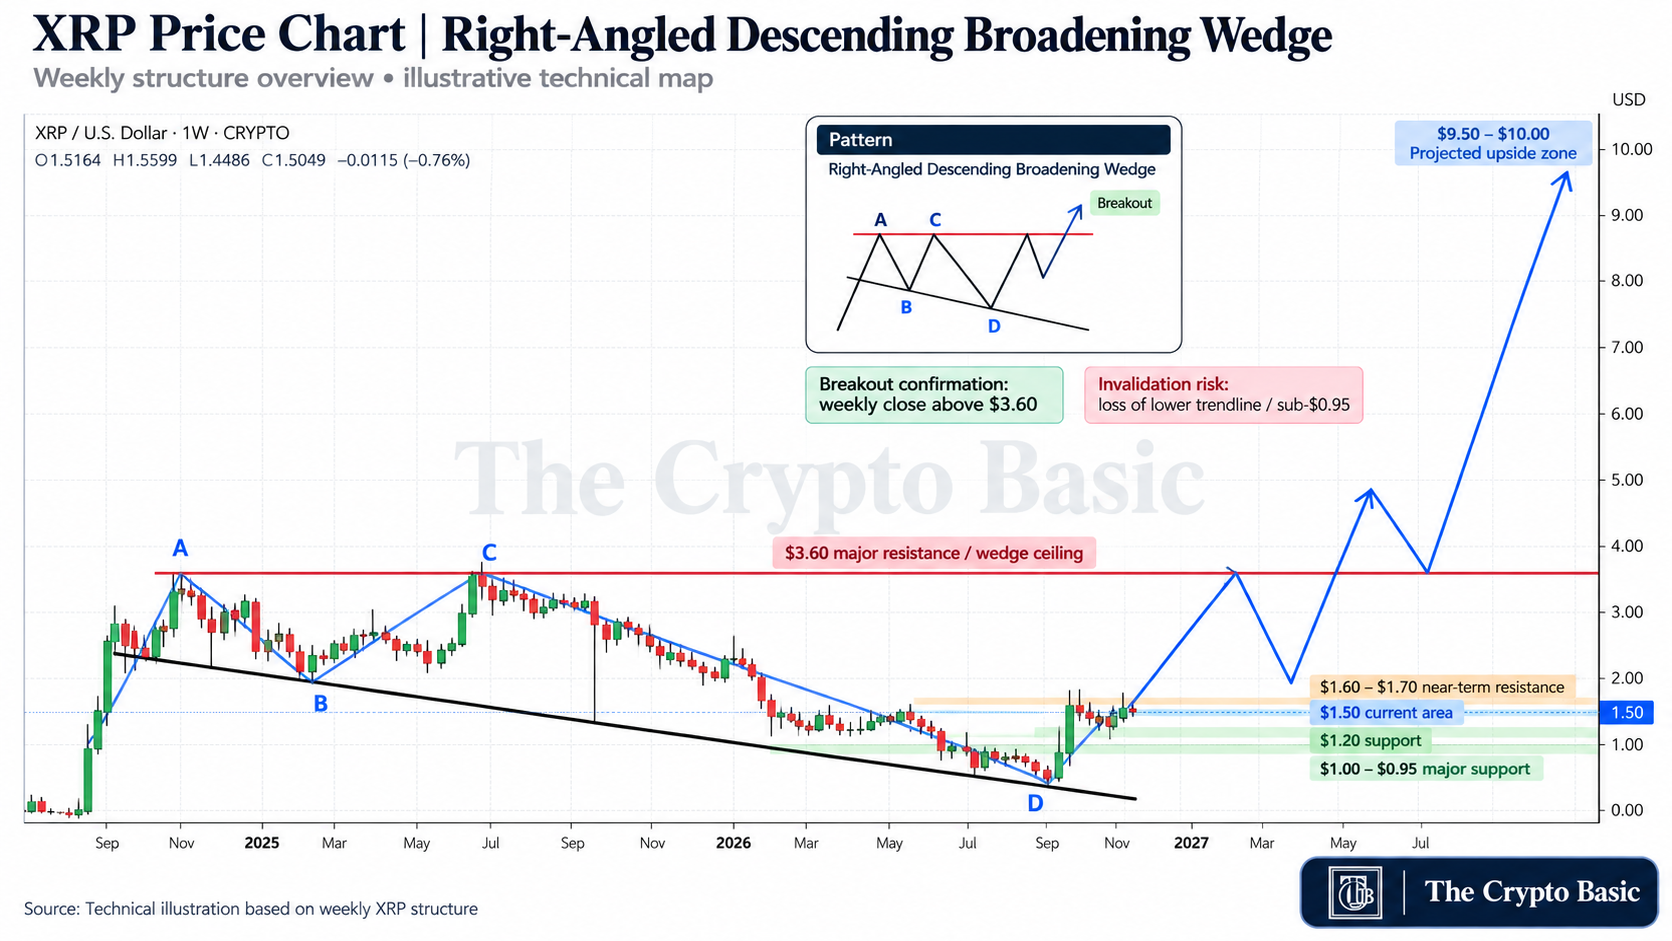
XRP is trading inside a large right-angled descending broadening wedge on the weekly chart, with horizontal resistance near $3.40 and a falling lower boundary that has repeatedly contained deeper pullbacks.
The latest rebound from around $0.95 keeps the structure alive, but XRP still has considerable ground to recover before the pattern can confirm a bullish breakout.
How the XRP Broadening Wedge Is Formed
Unlike a normal triangle that narrows over time, this structure expands.
Its upper boundary remains almost flat around $3.40-$3.50, while the lower boundary slopes downward. This creates progressively wider swings between resistance and support.
The chart identifies four major turning points.
Point A formed near $3.40 in early 2025 before XRP fell toward roughly $1.75-$1.80 at B. Price then recovered to the same upper resistance around $3.40-$3.50 at C, but sellers again rejected the move.
The subsequent decline was much deeper, carrying XRP toward approximately $0.95-$1.00 at D during 2026. That low touched the falling lower boundary of the wedge before price rebounded toward the current $1.50 region.
This A-B-C-D sequence is what gives the pattern its broadening shape.
$0.95-$1.00 Remains the Major Structural Support
The recent low around $0.95-$1.00 is the most important visible support on the chart.
Holding above that area preserves the recovery from point D and keeps XRP inside the broader bullish interpretation. A renewed decline through the recent low would put the descending lower trendline back under pressure.
That trendline itself approaches roughly the $0.85-$0.90 area later in 2026. A sustained weekly break beneath it would weaken the wedge setup because price would be leaving the structure through its lower boundary rather than recovering toward resistance.
XRP First Needs to Return to $3.40
The major upside level is much clearer.
XRP has been rejected twice around $3.40-$3.50, making this the ceiling bulls eventually need to clear.
From the chart’s $1.5049 reference price, reaching $3.40 would require an advance of roughly 126%.
The projected path first shows XRP returning to that resistance before another large pullback. This means the chart does not assume price will move straight higher from current levels.
A decisive weekly breakout above $3.40 would be the first major confirmation that the broadening wedge is resolving to the upside.
Chart Maps $4.80 and $10 Areas After Breakout
The blue projected path then shows XRP advancing to roughly the $4.70-$5.00 region after clearing the upper boundary.
Price is subsequently shown returning toward $3.40, effectively testing the old resistance as new support.
That retest would be important. If XRP broke above $3.40 and later defended the same level, it would strengthen the case that the multi-year ceiling had genuinely flipped into support.
The final projected leg extends toward approximately $9.50-$10.