




Bitcoin and XRP test support as Venice Token and Pump.fun retreat while Aerodrome rises. Key daily levels, signals, and confirmation points for October 9, 2026.
| Asset | Price | 24-hour change | Aggregate 24-hour volume | Rank |
|---|---|---|---|---|
| Bitcoin | $82,360 | -0.43% | $42.63 billion | 1 |
| XRP | $1.39 | -1.46% | $3.36 billion | 5 |
| Venice Token | $23.04 | -8.40% | $125.65 million | 74 |
| Pump.fun | $0.005626 | -9.58% | $428.70 million | 43 |
| Aerodrome Finance | $0.8453 | +6.22% | $127.67 million | 85 |
Bitcoin MACD Weakens Below Its Signal Line
Bitcoin closed October 8 at $81,683.80 on Kraken, down 1.91% from $83,276.10. The completed candle ranged from $80,328.60 to $83,467.70. Its 4,015 BTC turnover was 1.47 times the preceding 20-day average, giving the decline above-average activity on this exchange pair.
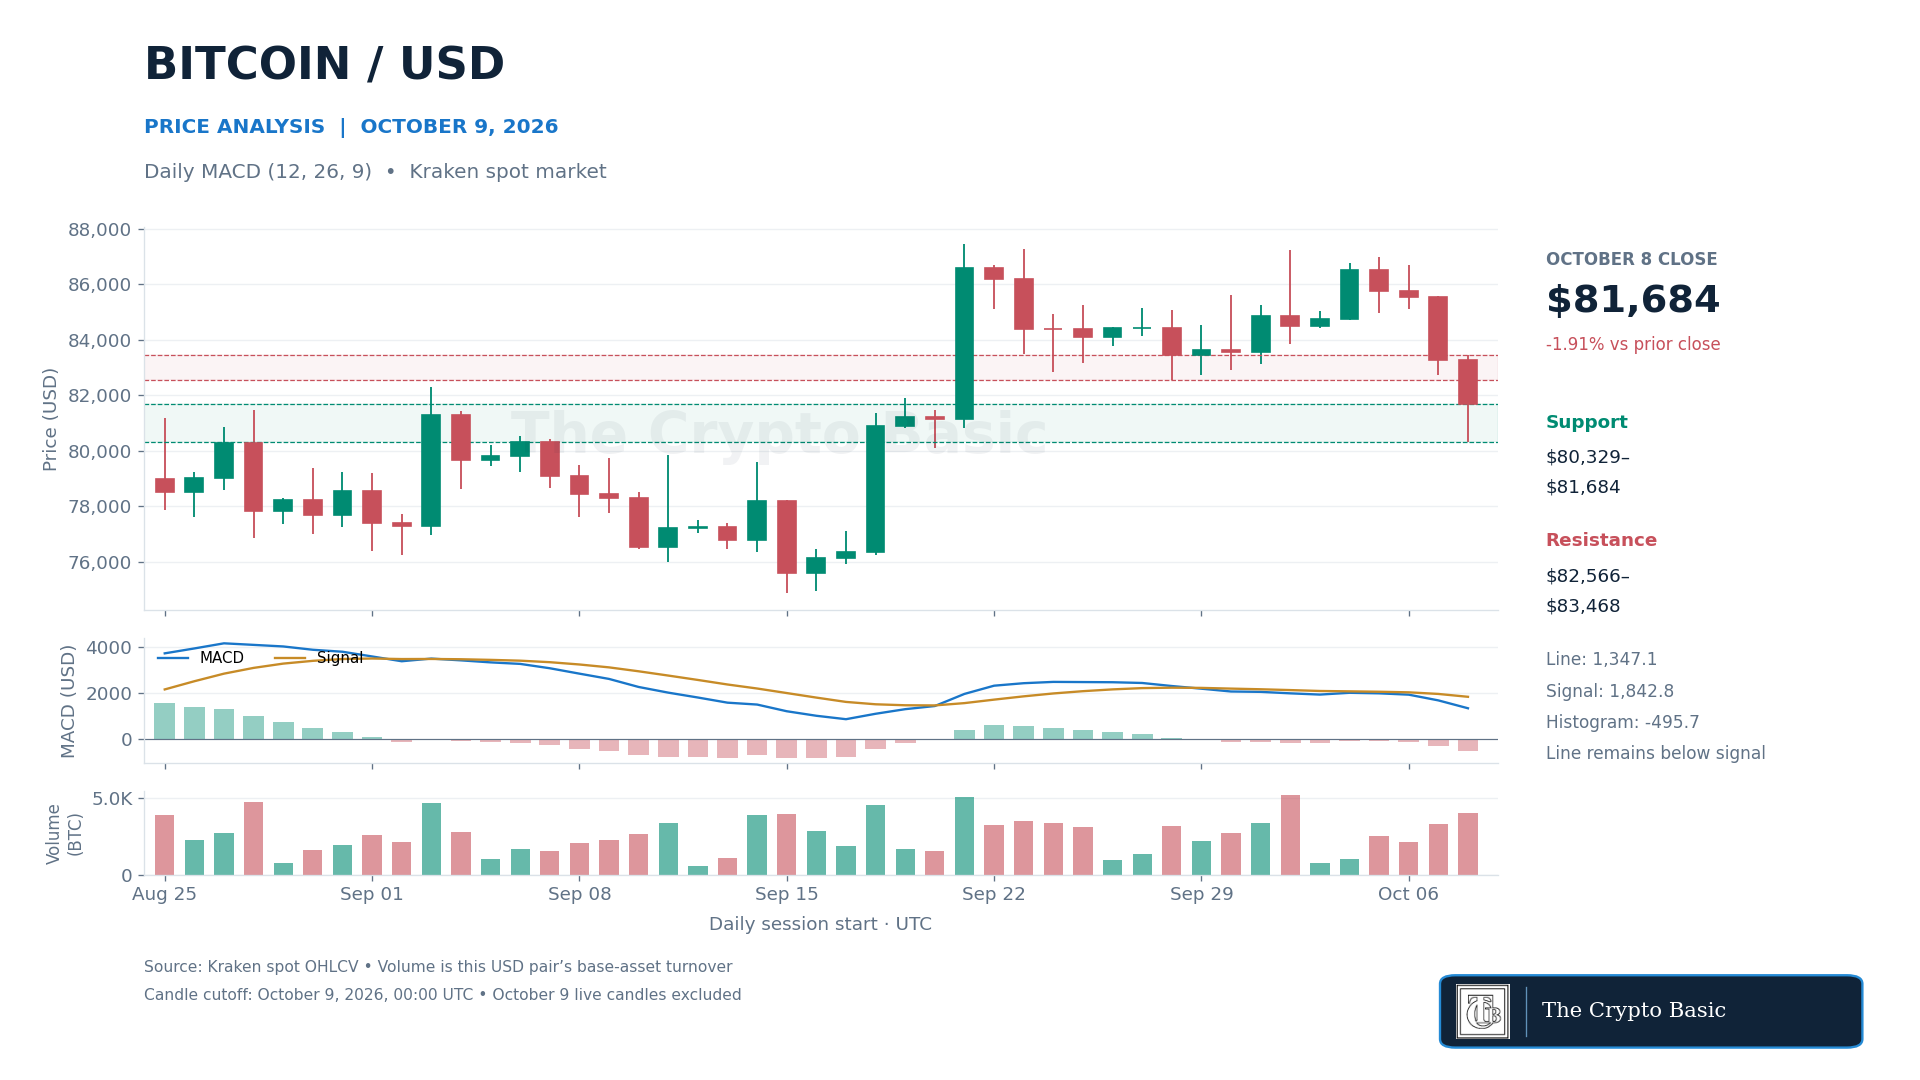
Daily MACD, calculated with 12- and 26-day exponential averages and a nine-day signal EMA, remained below its signal line. The MACD line was positive at 1,347.1, but the signal line was higher at 1,842.8. The histogram fell to -495.7 from -279.2.
This was not a new crossover. It was an expansion of an already negative histogram. Completed four-hour MACD also remained below its signal line, maintaining the weaker short-term momentum reading.
The first support zone is $80,328–$81,684, bounded by the October 8 low and close. A daily close below $80,328 would confirm a breakdown and expose the $79,600–$80,000 congestion area, followed by the September 18 region near $76,200–$77,000.
Bulls need a daily close above $82,566 and then $83,468 to stabilize the chart. Clearing $83,468 would reopen $84,432. A breakout that subsequently closes below $82,566 would lose its initial confirmation.
Compared with the previous report’s $82,722, BTC was approximately 0.44% lower.
XRP Holds Above the September–October Swing Low
XRP closed October 8 at $1.37915, down 2.93%, after trading between $1.31770 and $1.42869. Daily turnover was 50.66 million XRP, roughly in line with the preceding 20-day average. CoinGecko’s later $1.39 quote remained below the first Fibonacci recovery level.
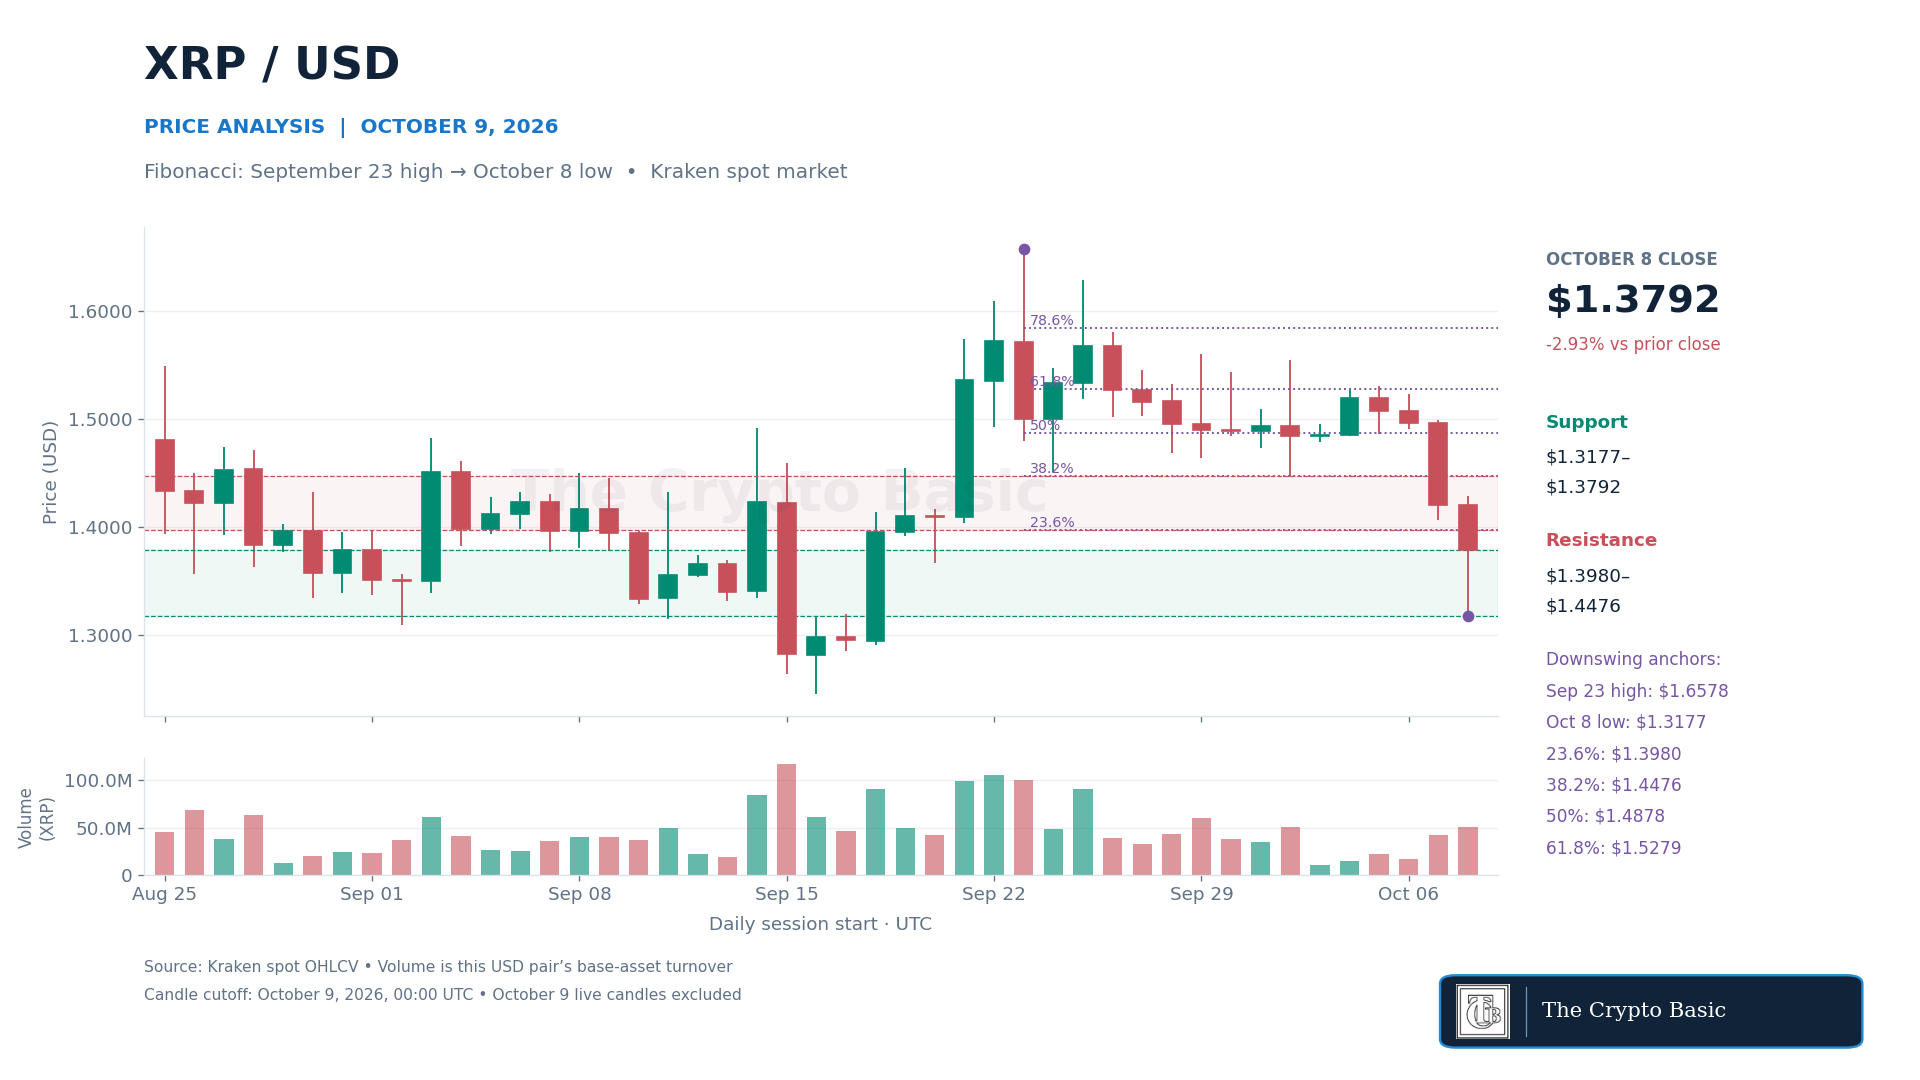
The Fibonacci grid measures the downswing from the September 23 high of $1.65780 to the October 8 low of $1.31770. The 23.6%, 38.2%, 50% and 61.8% retracements stand at $1.39796, $1.44762, $1.48775 and $1.52788.
Because the latest completed close remained below the 23.6% retracement, no closing reversal was confirmed.
The October 8 low at $1.31770 is immediate support. A completed daily close below it would invalidate the initial rebound case and expose the September 15–16 lows at $1.24610–$1.26409.
A close above $1.39796 would be the first recovery signal, but $1.42869 and the 38.2% retracement at $1.44762 form the stronger confirmation band.
A close above $1.44762 could extend the retracement toward $1.48775; a subsequent return below $1.39796 would weaken that scenario.
XRP was approximately 5.4% below its $1.47 aggregate quote in the October 7 report, the latest edition in which it appeared.
Venice Token Volatility Expands Near September Support
Venice Token closed October 8 at $22.775, down 10.81%, after a $21.216–$25.798 range. Daily ATR (14, Wilder) increased to $2.955 from $2.829, while the session’s $4.582 range measured approximately 1.55 ATR.
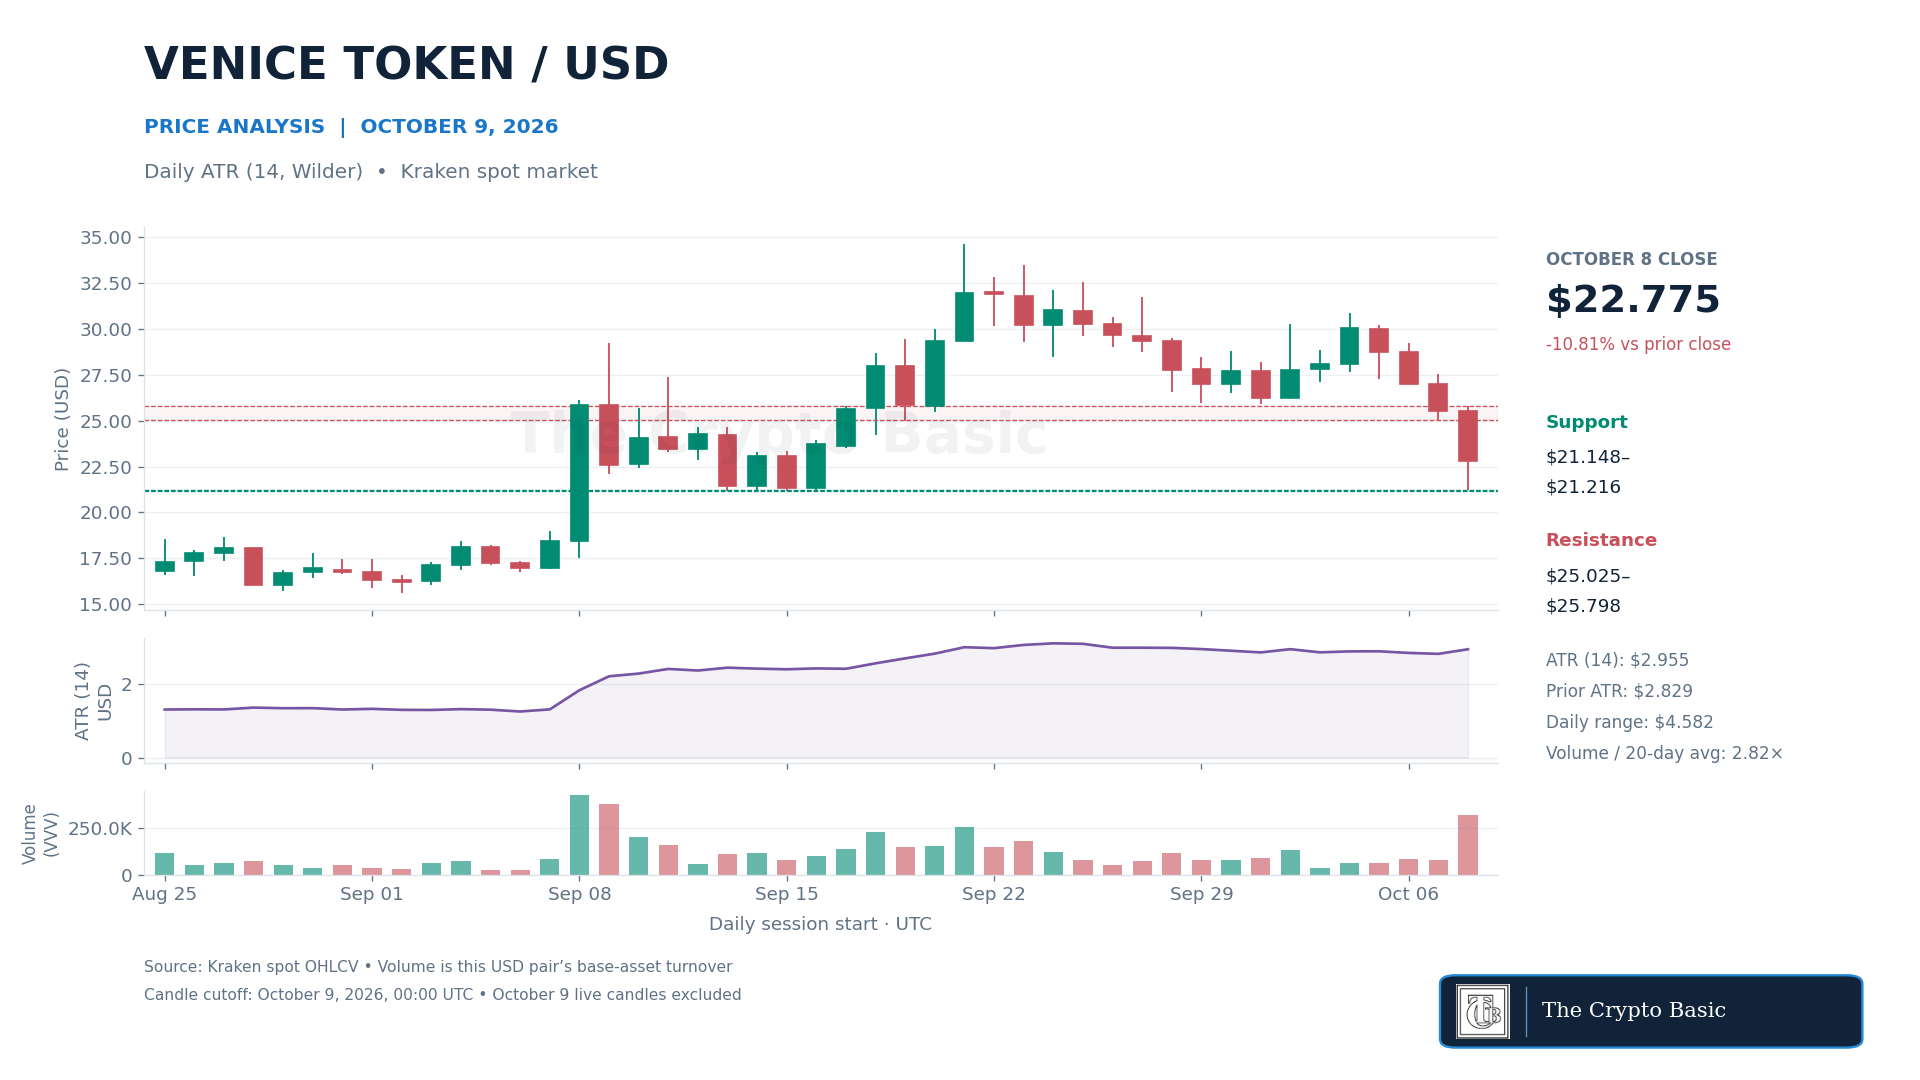
Kraken turnover reached 318,941 VVV, 2.82 times its preceding 20-day average.
The $21.148–$21.216 area is support because it contains the September 15 low and the latest intraday low. A completed close below $21.148 would confirm a loss of that floor, leaving the wider September 8–9 structure around $17.51–$18.44 as the next visible zone.
For a recovery, VVV first needs a close above $25.025–$25.798. Clearing that band would reopen $27.522 and reduce the immediate downside pressure. A rebound that fails below $25.025 would leave the expanded-volatility decline unresolved.
Pump.fun RSI Cools Without Losing Its Daily Midline
Pump.fun closed October 8 at $0.005540, down 11.00%, after ranging between $0.005263 and $0.006374. Kraken turnover was 2.08 billion PUMP, 1.49 times the preceding 20-day average.
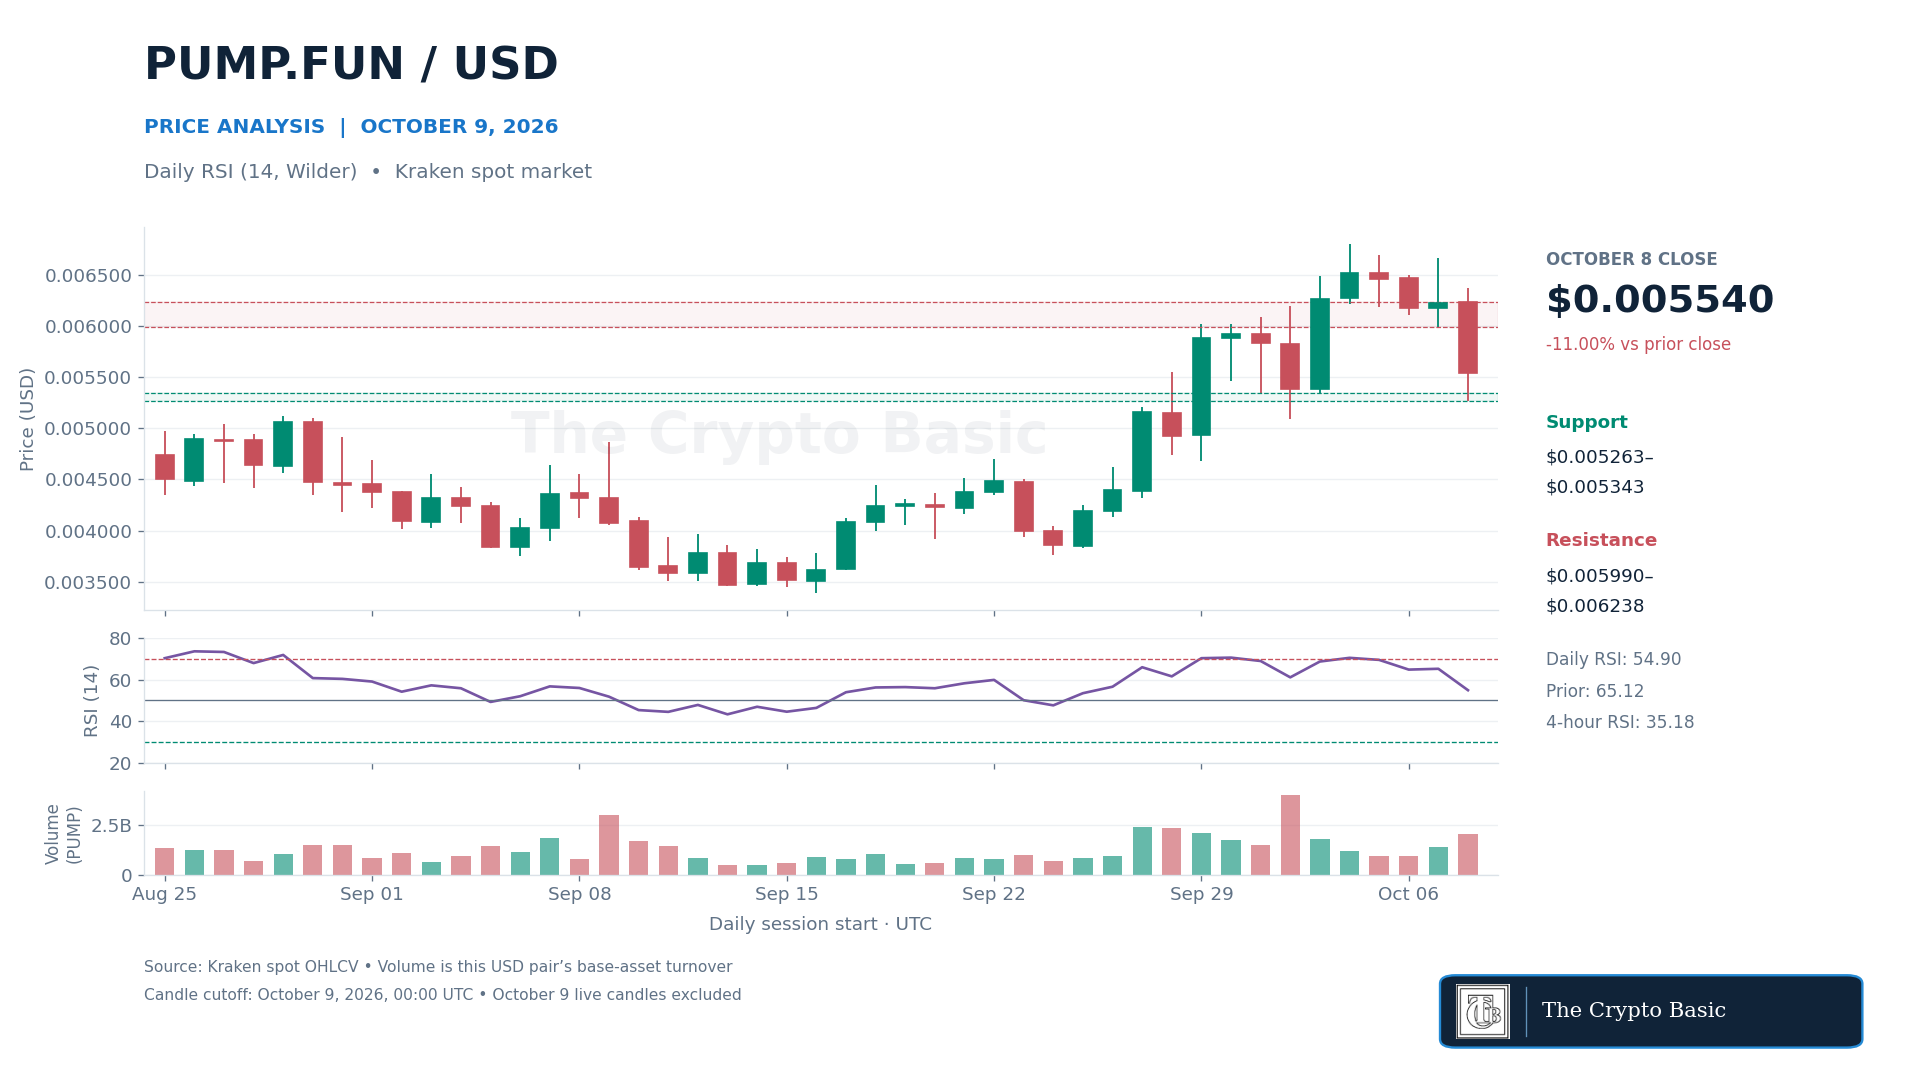
Daily RSI (14, Wilder) dropped to 54.90 from 65.12. The reading remains above the neutral 50 line, meaning daily momentum weakened without turning fully bearish. Completed four-hour RSI was lower at 35.18, showing greater short-term pressure than the daily reading.
Support sits at $0.005263–$0.005343. A daily close below $0.005263 would confirm a range failure and expose $0.005091, followed by the late-September breakout area near $0.00468–$0.00474.
Bulls need a closing reclaim of $0.005990 and then $0.006238. A close above $0.006238 would reopen $0.006670–$0.006800, while a rejection that returns below $0.005990 would keep the setup range-bound.
Aerodrome Tests Resistance Above Rising Daily Averages
Aerodrome Finance closed October 8 at $0.8303, up 4.32%, within a $0.7691–$0.8426 range. The 1.91 million AERO traded on Kraken was 1.53 times the preceding 20-day average.
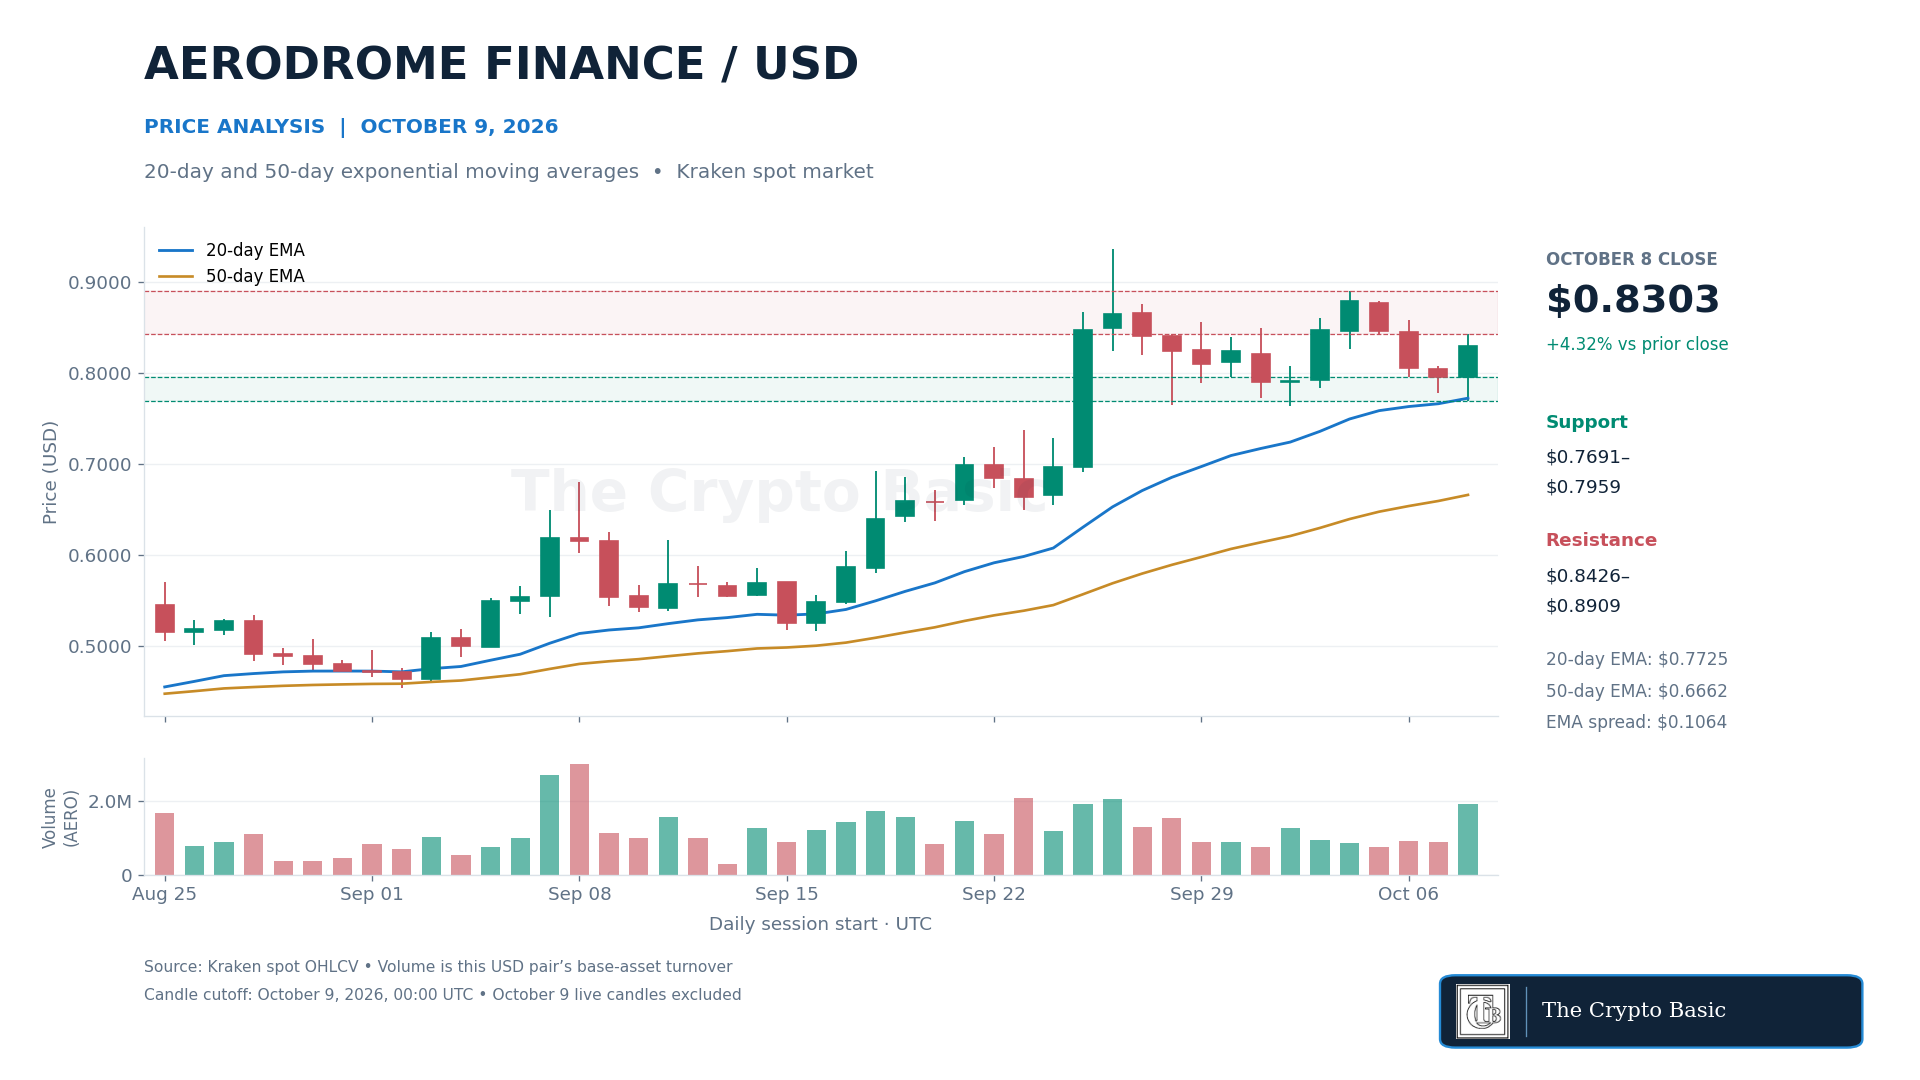
CoinGecko’s $0.8453 quote subsequently moved above the completed candle’s high, but that intraday move was not a confirmed daily breakout.
The 20-day EMA rose to $0.7725 and the 50-day EMA to $0.6662, leaving the shorter average above the longer one by $0.1064. Price remained above both averages on the completed daily candle.
On the four-hour chart, the 20-period and 50-period EMAs were almost equal at $0.8095 and $0.8103, indicating that the shorter timeframe was still consolidating.
A daily close above $0.8426 would confirm the initial breakout and expose $0.8909, followed by the September 26 high at $0.9366.
A close back below $0.7959 would weaken the advance, while a break below $0.7691 and the 20-day EMA near $0.7725 would invalidate the near-term bullish setup. The 50-day EMA at $0.6662 is the deeper trend support.