




Hyperliquid rises 18.3% as Bitcoin loses weekend support and Ethereum nears $2,230. October 30 analysis tracks BTC, ETH, HYPE, BNB and XRP charts and levels.
The broader sell-off followed news of a suspected Binance hack, adding to pressure on Bitcoin, Ethereum, XRP and other major cryptos. Reuters reported that Bitcoin fell to a six-week low as the exchange investigated the breach.
Binance estimated the incident’s impact at approximately $6.3 billion and said around $3 billion had been frozen on-chain. The exchange temporarily suspended deposits and withdrawals and pledged to cover all losses using its SAFU fund and company funds.
Bitcoin Confirms a Break Below Weekend Support
Bitcoin closed Thursday at $77,800, down 4.29%, after reaching $81,882 earlier in the session. The subsequent decline to $77,688.10 established the lowest traded price in the latest 30 completed daily candles. The close was also below Saturday’s $79,120.80 floor, invalidating the recovery condition identified in our October 29 report.
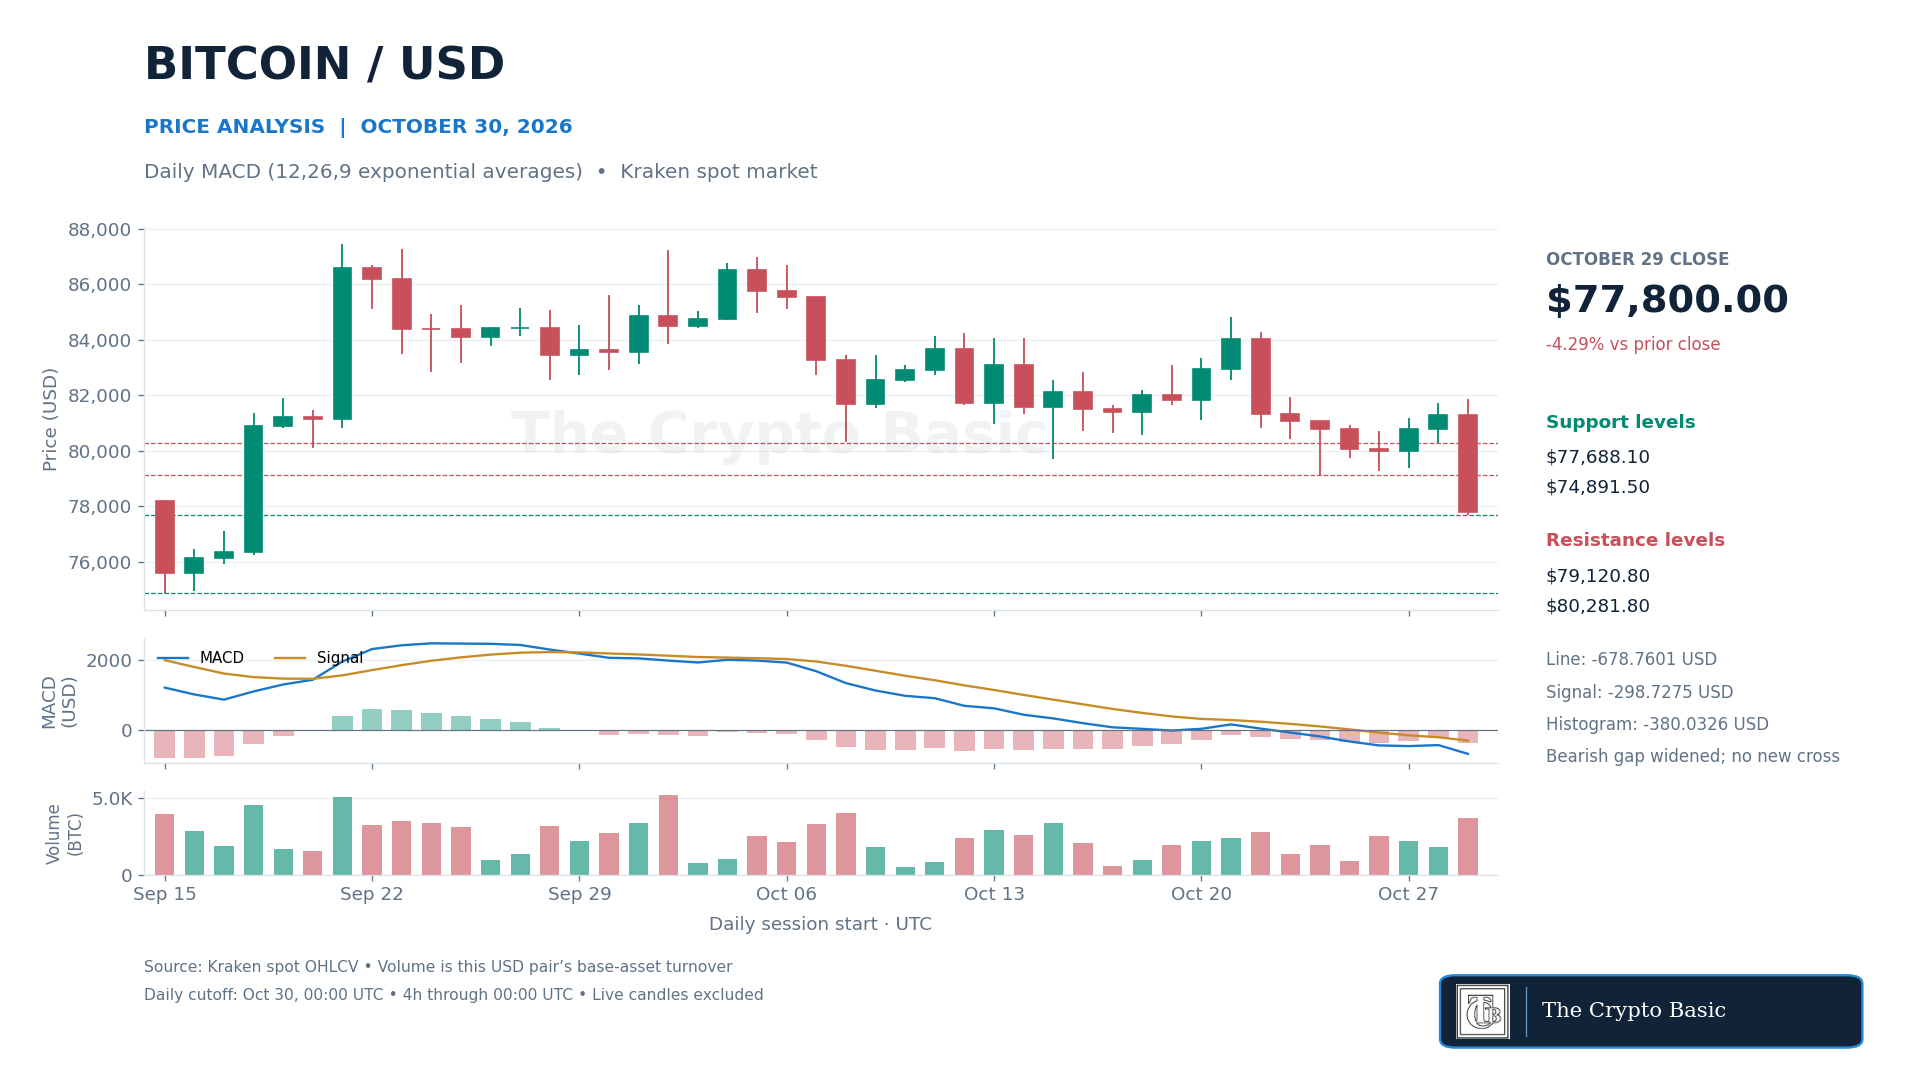
Daily MACD, using 12- and 26-period exponential averages and a nine-period signal EMA, deteriorated. The line fell to −678.76 against a −298.73 signal. The histogram widened below zero to −380.03 from −224.19. This was an expansion of an existing bearish gap, not a new line-signal crossover.
The final completed four-hour candle closed at $77,800, near its $77,688.10 low, with MACD also below its signal. Selling pressure therefore remained evident into the daily close. The latest price of $77,998 showed only a modest recovery from that settlement.
A daily close below $77,688.10 would extend the breakdown. The September 15 low at $74,891.50 is a farther historical reference, rather than an immediate forecast.
To repair the structure, Bitcoin first needs to reclaim $79,120.80, followed by Wednesday’s $80,281.80 low. A close above Thursday’s $81,882 high would invalidate the latest bearish reversal.
Ethereum RSI Approaches Oversold Territory
Ethereum closed Thursday at $2,249.01, falling 4.59% after trading between $2,230.19 and $2,376.99. The close lost Saturday’s $2,279.80 floor, which the October 28 report had identified as the boundary of the weekend recovery. Thursday’s low was the lowest in the latest 60 completed daily sessions.
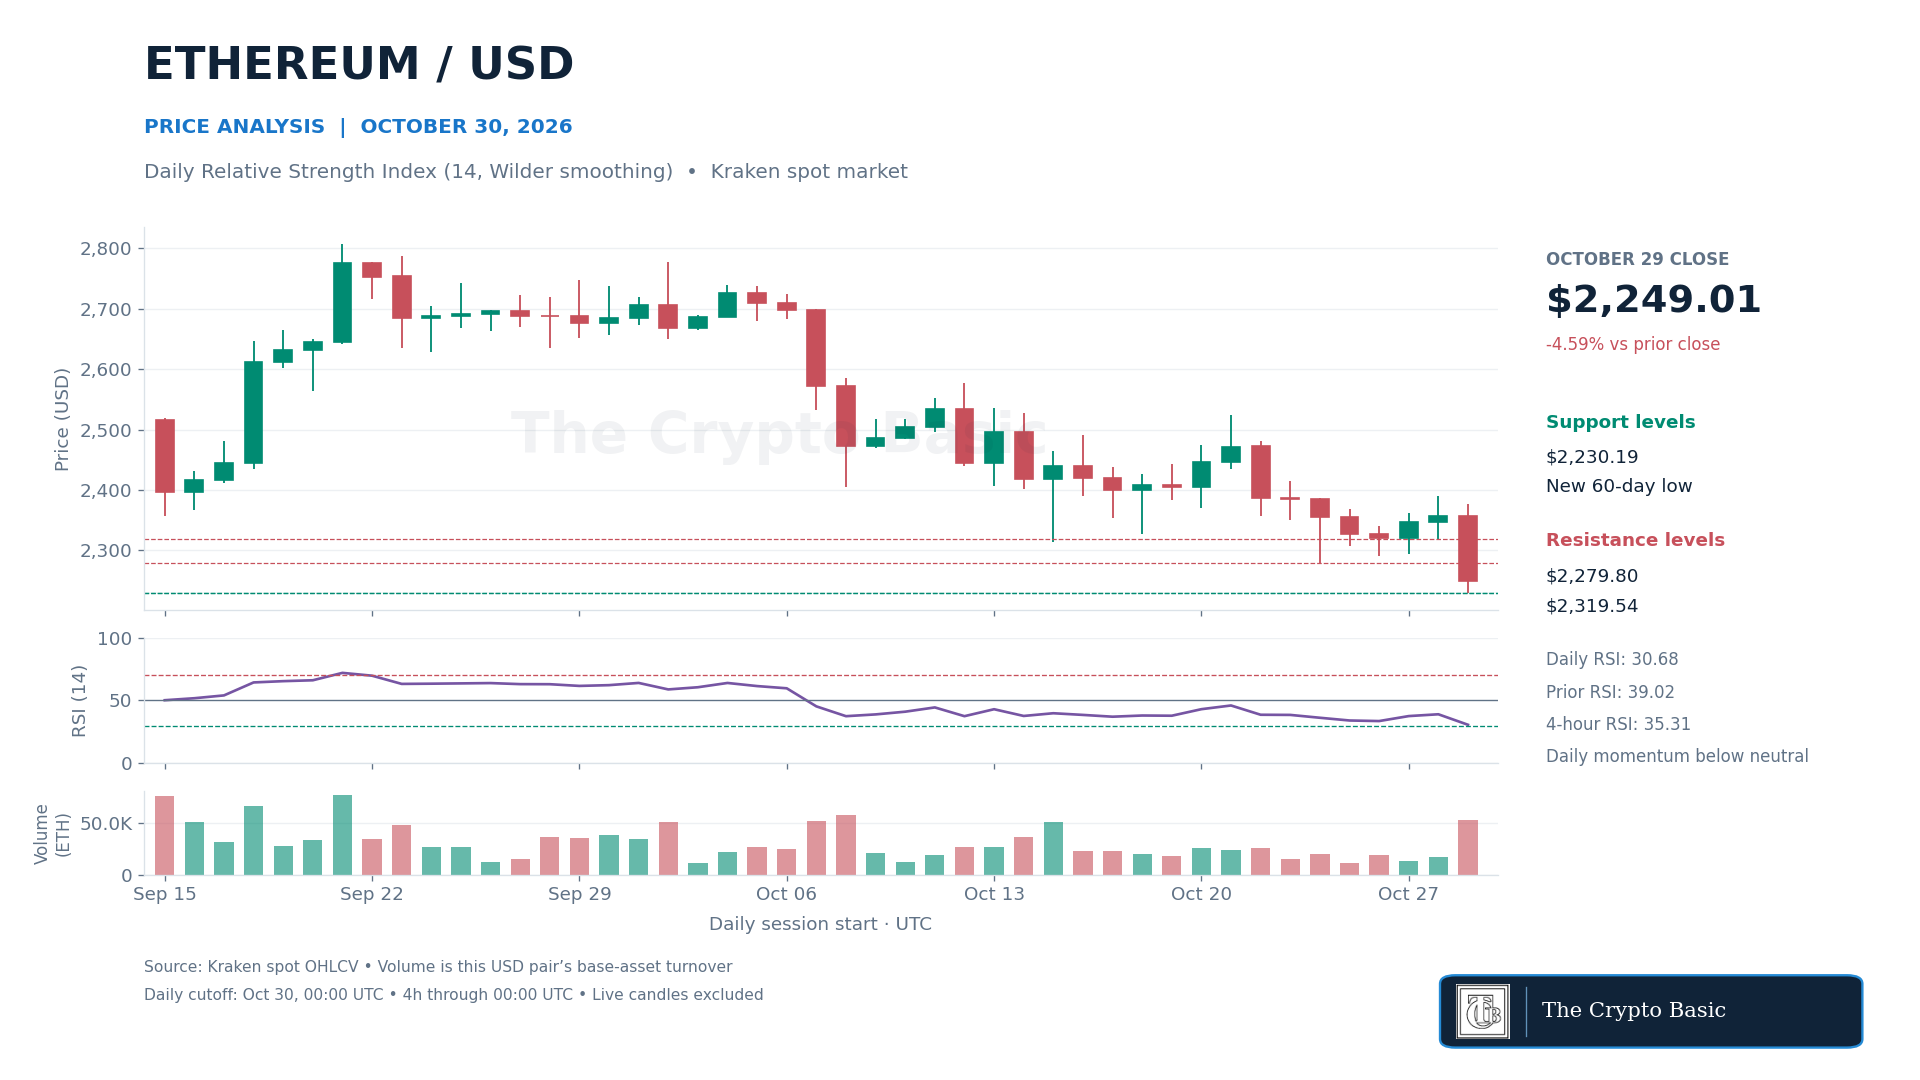
The daily 14-period RSI, calculated with Wilder smoothing, fell to 30.68 from 39.02. Momentum approached the conventional oversold threshold of 30 but had not crossed below it at the close. Proximity to that threshold does not confirm that selling has ended or that a rebound must follow.
The latest completed four-hour RSI stood at 35.31. That candle also closed at $2,249.01 after reaching $2,230.19, leaving both timeframes with weak momentum. The latest price of $2,231.74 was close to Thursday’s low, but Friday’s candle remained unfinished.
A daily close beneath $2,230.19 would confirm another downside extension. The immediate recovery test is $2,279.80, followed by Wednesday’s $2,319.54 low.
Regaining those levels would repair the broken support area. A close above $2,376.99 and then Wednesday’s $2,389.93 high would provide stronger evidence that the latest decline is being reversed.
Hyperliquid Reclaims Both Daily Averages
Hyperliquid closed Thursday at $88.79, gaining 10.02% after a wide $78.08–$97.00 session. The close cleared the $82.45 resistance identified in our October 28 report. The $97.00 high was the strongest in the latest 30 completed sessions, although price finished well below it.
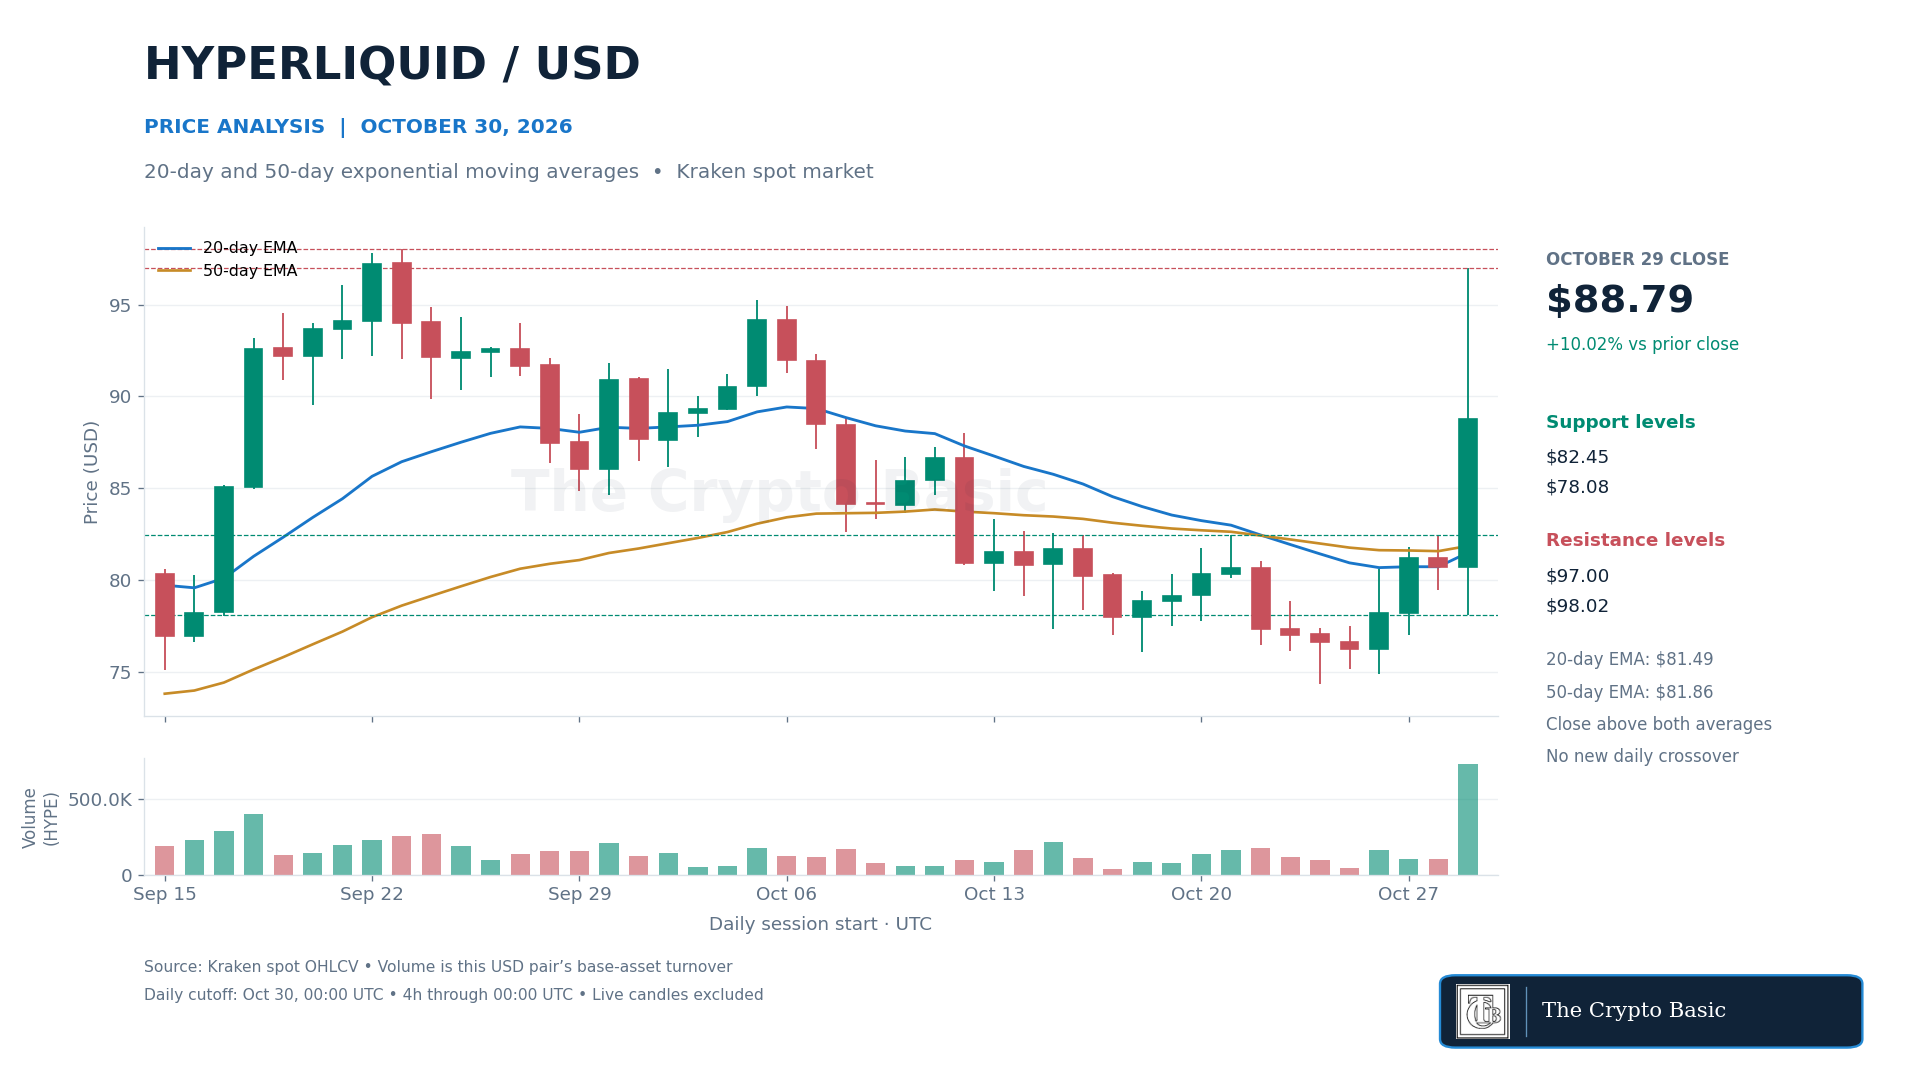
The 20-day exponential moving average rose to $81.49 from $80.72, while the 50-day EMA increased to $81.86 from $81.57. Price closed above both. However, the faster average remained below the slower one, so the recovery did not produce a bullish daily moving-average crossover.
Daily turnover reached approximately 733,081 HYPE, or 6.71 times the preceding 20-session average on the same exchange pair. That indicates substantially greater participation in the advance. The final four-hour candle nevertheless fell from $93.92 to $88.79, showing a late-session retreat without establishing its cause.
A daily close above $97.00 would confirm a break of Thursday’s high and bring the September 23 high of $98.02 into view.
A return below $82.45 would weaken the confirmed breakout and expose the daily average area near $81.49–$81.86. Losing Thursday’s $78.08 low would invalidate the latest expansion; the broader weekend floor remains $74.33.
BNB Reverses Below Its Lower Bollinger Band
BNB closed Thursday at $696.64, down 8.27% due to the Binance hack, after first reaching $763.84 and then falling to $675.59. The session exceeded Wednesday’s high before reversing below its low, producing a broad outside-day decline. Thursday’s low was the weakest in the latest 30 completed sessions.
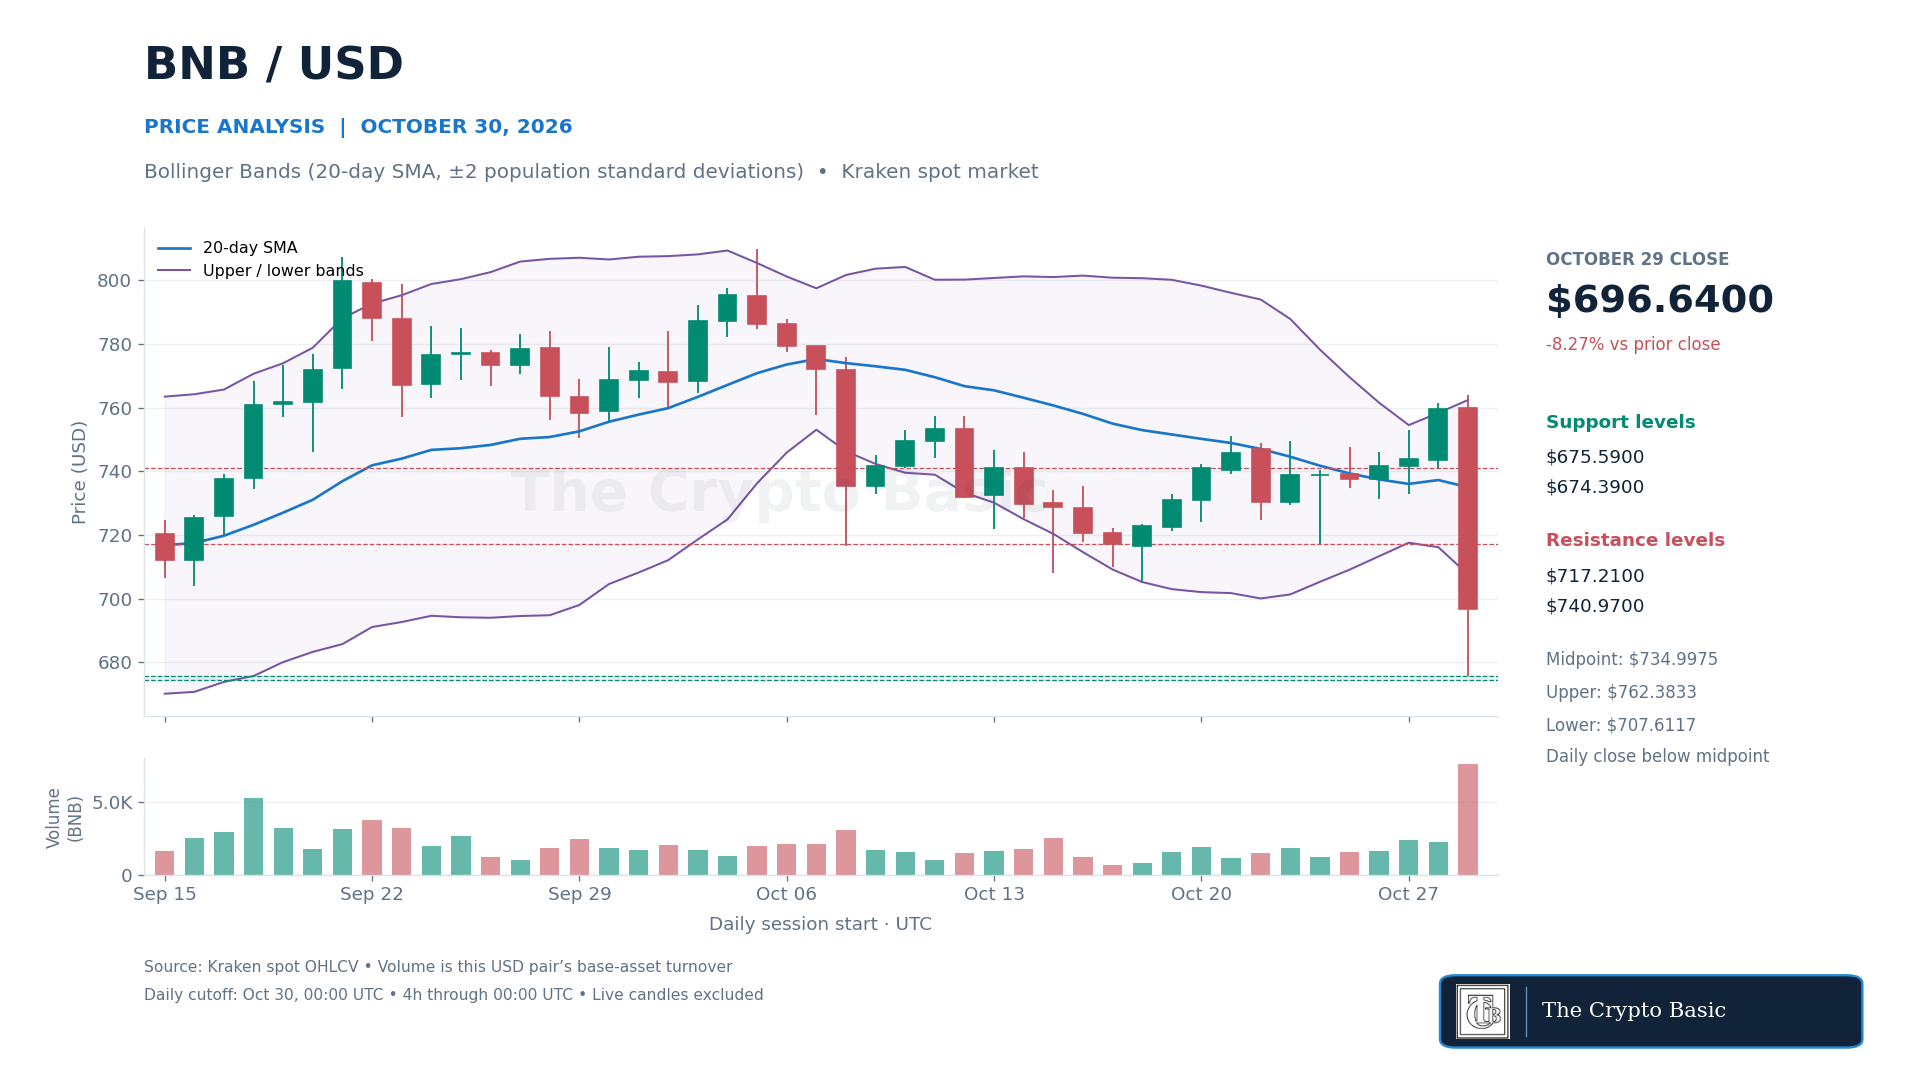
Daily Bollinger Bands, using a 20-day simple moving average and two population standard deviations, placed the midpoint at $735.00 and the lower band at $707.61. The close finished beneath the lower band. The midpoint declined from $737.25, while the band envelope widened sharply as volatility increased.
The final completed four-hour candle also closed beneath its lower band at $718.65. The latest $717.20 price represented a rebound from the daily close, but it did not constitute a confirmed daily return inside the bands. These levels will move as new candles finish.
Reclaiming Saturday’s $717.21 low at a daily close would repair an initial price threshold. Further confirmation requires the midpoint near $735.00 and Wednesday’s $740.97 low.
A close above $763.84 would overturn Thursday’s reversal. On the downside, $675.59 and the September 1 low at $674.39 form the next historical support area; losing both would extend the decline.
XRP $1.20 Support Holds as RSI Nears Oversold
XRP has bounced from the $1.20 area after a sharp two-day decline, but the daily structure remains bearish as price trades below its major moving averages and momentum stays close to oversold territory.
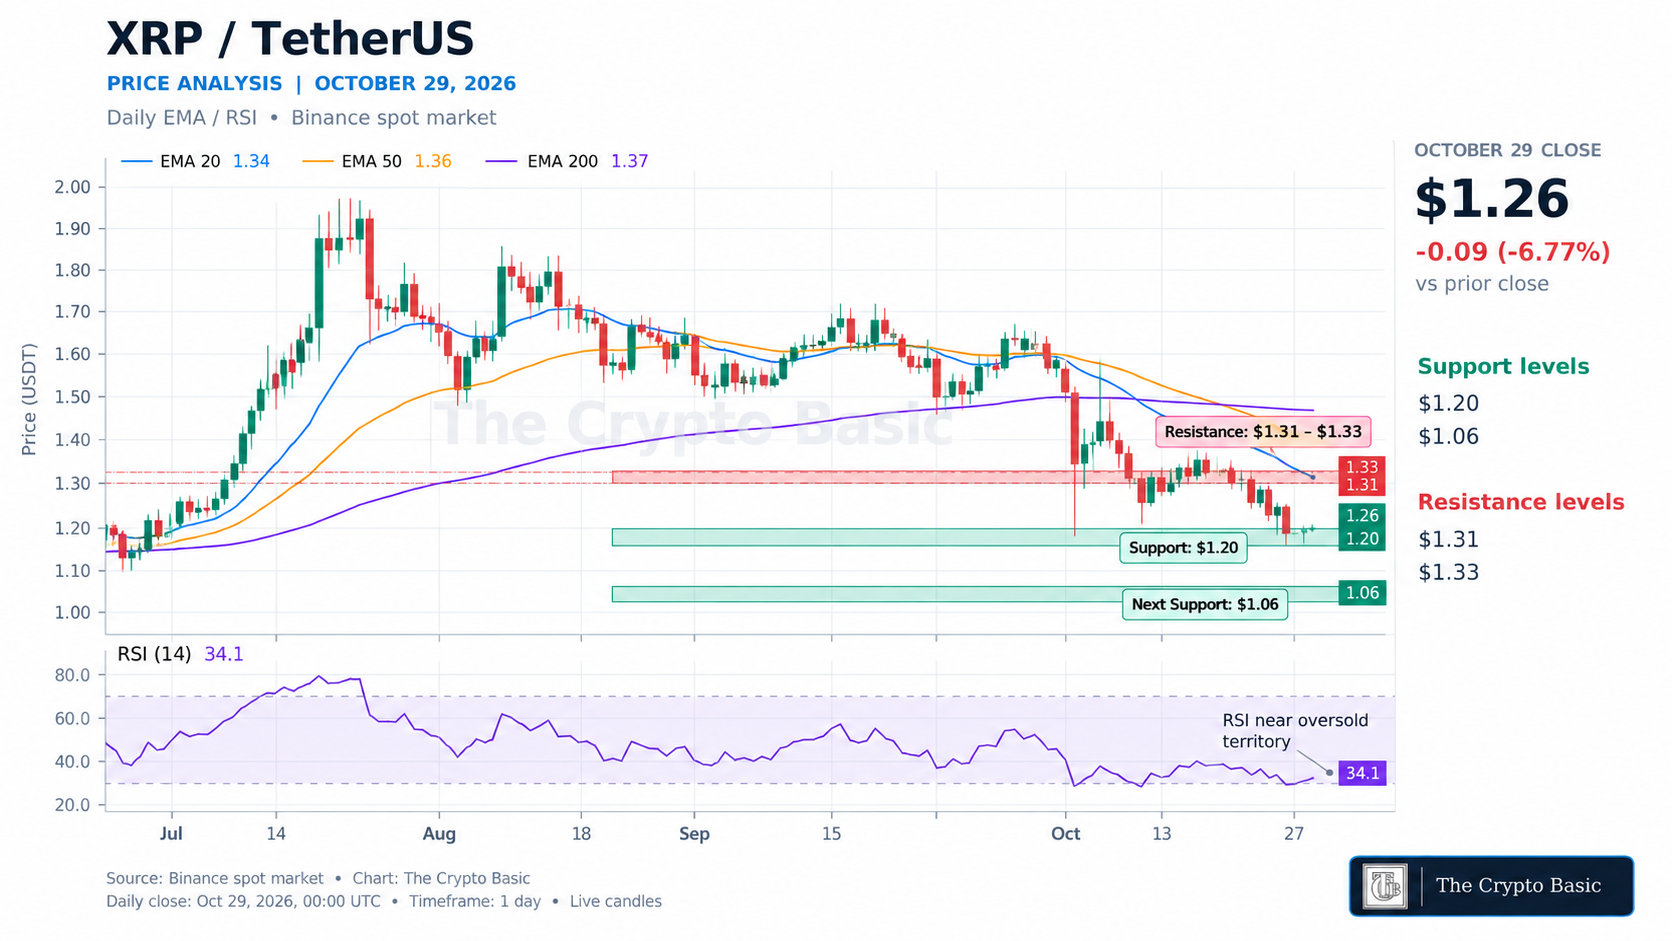
CoinMarketCap currently places XRP near $1.26, with a 24-hour range between $1.20 and $1.31. The latest fully closed Binance spot XRP/USDT daily candle tracked by ClosedCandle is dated Oct. 29 UTC and shows the broader daily trend still pointing down.
XRP entered Oct. 29 around $1.33 but fell as low as $1.22 before closing near $1.24. Selling continued into Oct. 30, briefly pushing price to approximately $1.20 before the rebound toward $1.26. Binance daily data therefore shows XRP losing the $1.30 area that had supported several sessions earlier in the month.
The decline coincided with a broader crypto selloff following Binance’s major security incident. Binance said its preliminary investigation identified approximately $6.3 billion in affected assets, with roughly $3 billion frozen on-chain. Bitcoin and other major cryptocurrencies also declined sharply as the incident unfolded.
Macro conditions provided little relief. The Federal Reserve kept rates at 3.75%–4% on Oct. 28 while saying inflation remained elevated, and two policymakers dissented in favor of another quarter-point increase.
The Binance daily chart shows RSI(14) at 34.1 on the latest closed candle. That places momentum below the neutral 50 level and close to the conventional oversold threshold of 30, but it does not yet confirm that selling has exhausted itself.
The moving-average structure remains more clearly bearish. XRP’s daily close was approximately 7.1% below the 20-period EMA, 8.7% below the 50-period EMA and 9.6% below the 200-period EMA. All three remain above price, showing that the current bounce has not yet changed the broader trend.
The nearest support is $1.20, today’s intraday low and a level XRP has now defended once.
From the verified $1.26 live quotation, another test of $1.20 would represent a decline of about 4.8%. A sustained daily close below $1.20 would weaken the rebound structure and could shift attention toward the approximately $1.06 region identified as the next broader daily support.
On the upside, XRP first needs to recover the $1.31-$1.33 zone, which acted as support before the latest breakdown. From $1.26, $1.33 sits roughly 5.6% higher.
A move through that area during an unfinished candle would not be enough on its own. The cleaner technical confirmation would be a completed daily close above $1.33 followed by price holding the reclaimed zone.
The next observable test is therefore straightforward: whether XRP can continue defending $1.20 and reclaim $1.31-$1.33 while daily RSI recovers from the low-30s.