




Ethereum tests $2,000 as XRP sets a 60-day low, Zcash drops 10%, Hyperliquid weakens and Jupiter rebounds in the Nov. 11 crypto market analysis today.
| Asset | Latest USD price | Past 24 hours | 24-hour market volume | Market-cap rank |
|---|---|---|---|---|
| Ethereum (ETH) | $2,061.21 | −2.43% | $14.02 billion | 2 |
| XRP | $1.058 | −3.17% | $2.34 billion | 6 |
| Zcash (ZEC) | $1,031.73 | −10.32% | $1.20 billion | 10 |
| Hyperliquid (HYPE) | $72.03 | −2.49% | $1.48 billion | 11 |
| Jupiter (JUP) | $0.260083 | +3.55% | $65.68 million | 78 |
Ethereum tests $2,000 as daily range expands
Ethereum fell 3.83% on Tuesday to close at $2,051 after trading between $2,002 and $2,133.92. The low marked its weakest price in 60 completed daily sessions. The latest $2,061.21 price was 3.29% below the $2,131.27 recorded in our November 9 Ethereum analysis.
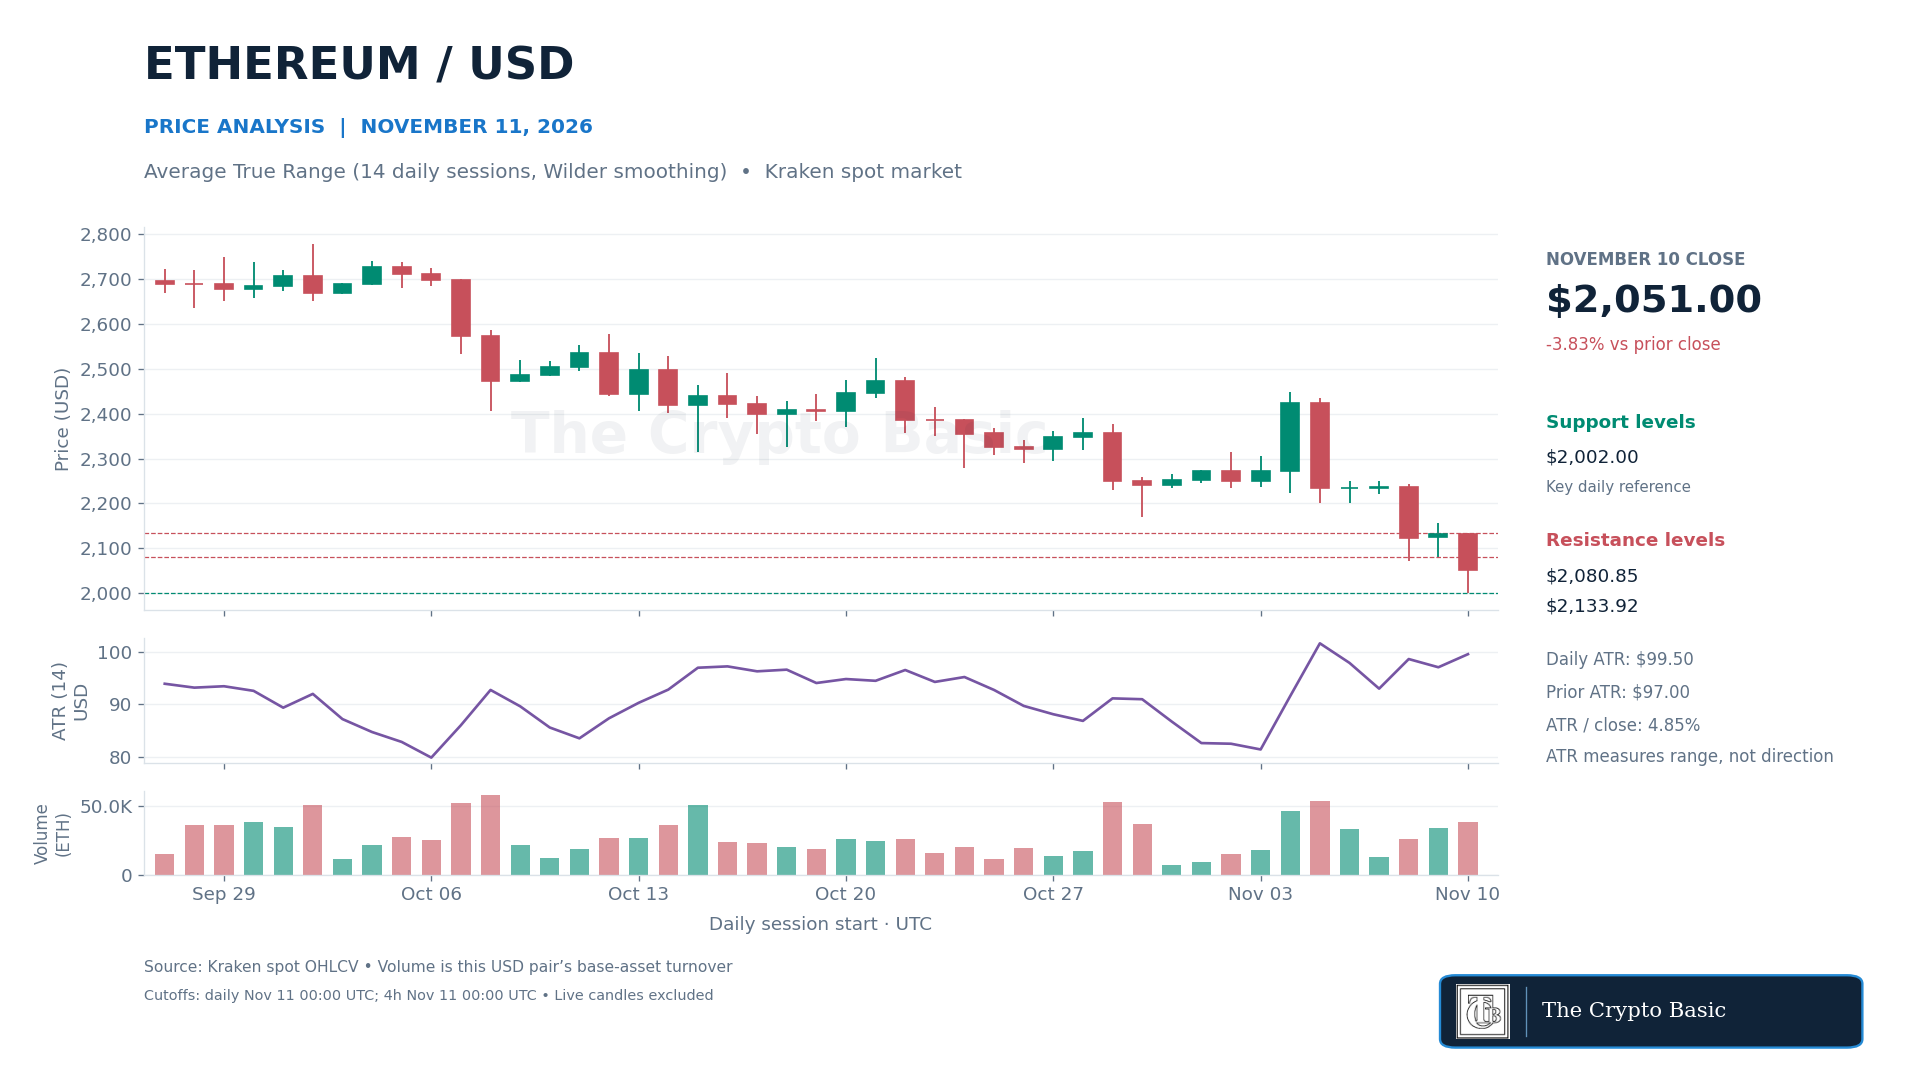
The 14-day average true range, calculated with Wilder smoothing, rose to $99.50 from $97.00. That equals 4.85% of Tuesday’s close and shows that the typical daily range has expanded. ATR measures movement in either direction, so the increase describes volatility rather than forecasting a decline.
The latest completed four-hour candle closed at $2,060.05, with four-hour ATR at $37.19. A daily close above $2,080.85 would recover Monday’s low, while $2,133.92 is the stronger breakout test. A close below $2,002 would confirm another extension lower and expose the August 13 low at $1,861.89. Reclaiming $2,133.92 would invalidate that immediate bearish continuation case.
XRP remains below two falling daily averages
XRP closed Tuesday at $1.05509, down 3.87%, after reaching $1.03011. That low was the weakest level in 60 completed daily sessions. The latest $1.058 price was 3.11% below the $1.092 recorded in Tuesday’s report.
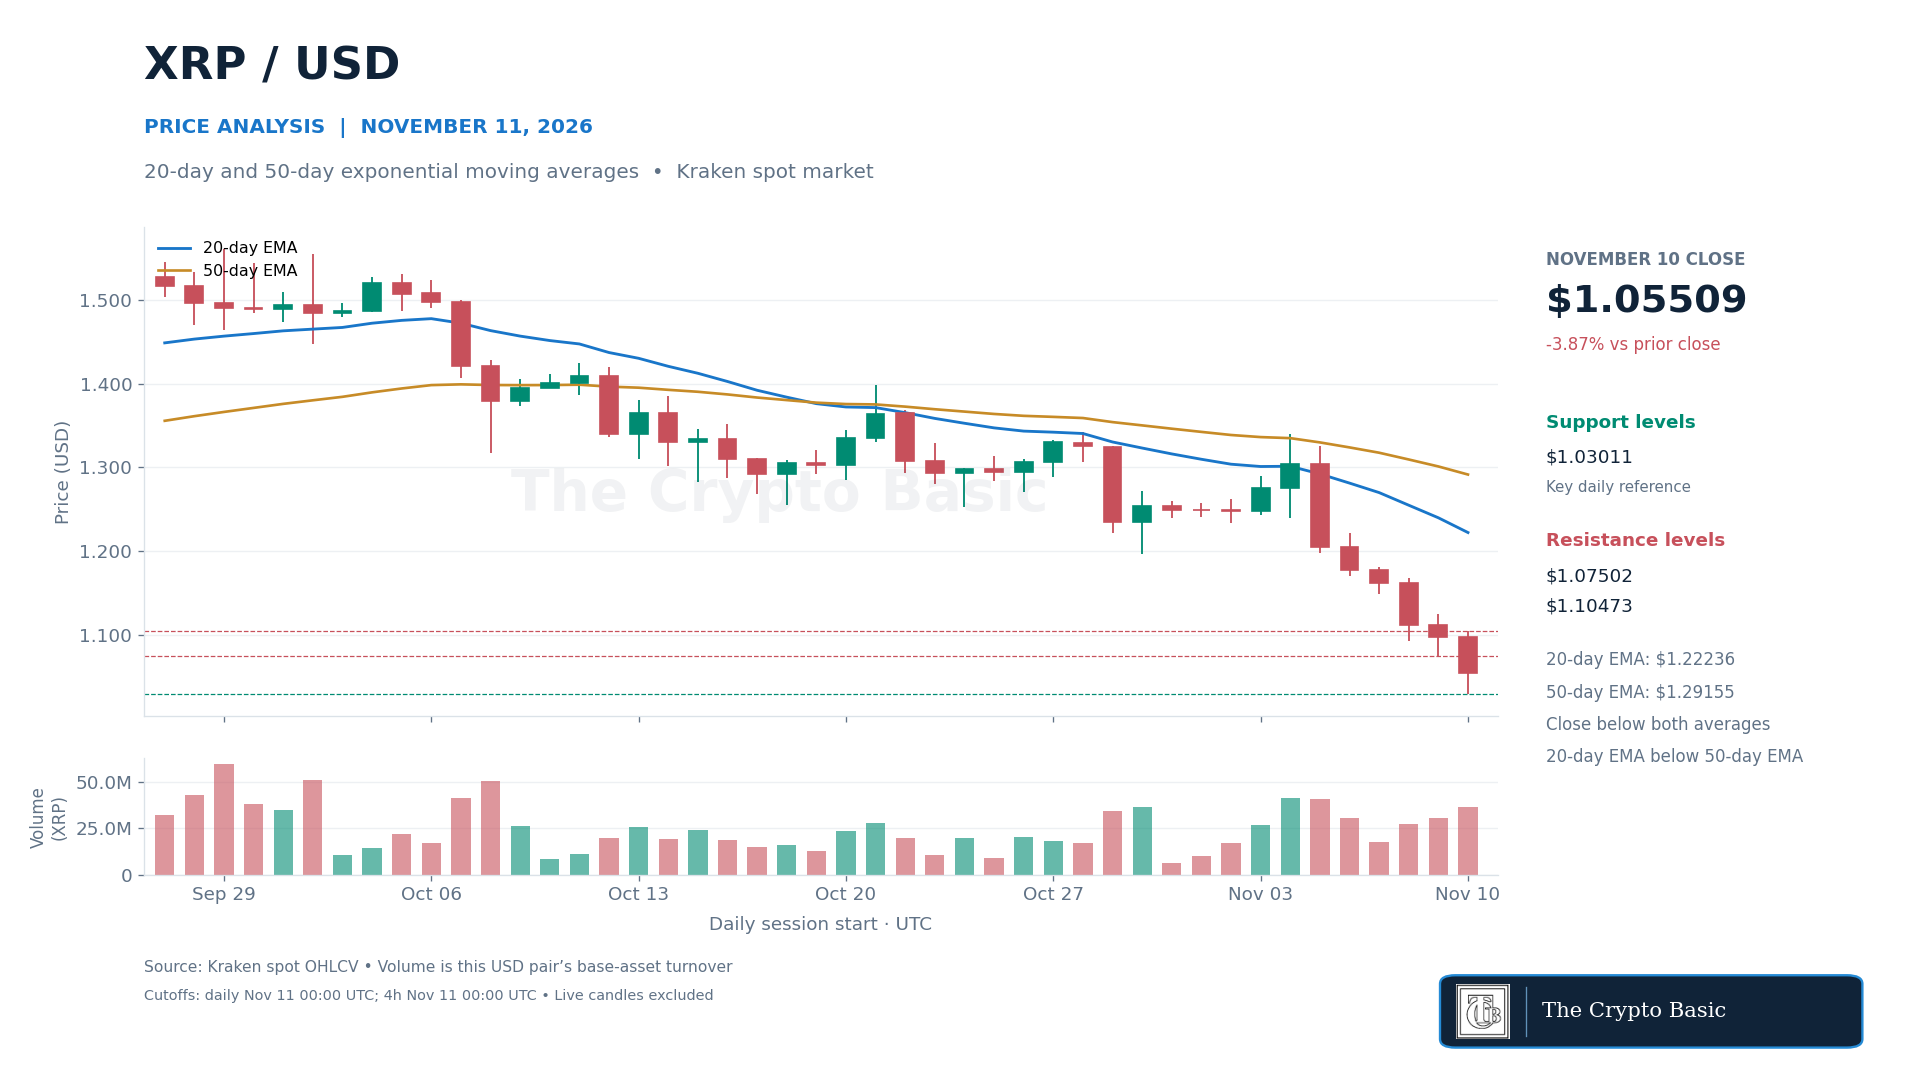
The 20-day exponential moving average fell to $1.22236, while the 50-day EMA declined to $1.29155. Price remains below both, and the faster average remains below the slower one. The latest candle therefore extends an established bearish alignment rather than creating a new crossover. The completed four-hour close at $1.05722 was also below its 20- and 50-period EMAs of $1.10324 and $1.16123.
A daily close above $1.07502 would recover Monday’s low, followed by resistance at Tuesday’s $1.10473 high. Regaining that high would weaken the immediate downside setup, although XRP would remain below both daily averages. A close below $1.03011 would confirm another lower low and bring the August 14 reference at $0.98471 into view.
Zcash MACD bearish crossover deepens
Zcash fell 10.28% on Tuesday to close at $1,043.82, after a session ranging from $993.69 to $1,196.98. The latest $1,031.73 price was 21.38% below the $1,312.37 recorded in our November 5 Zcash analysis.
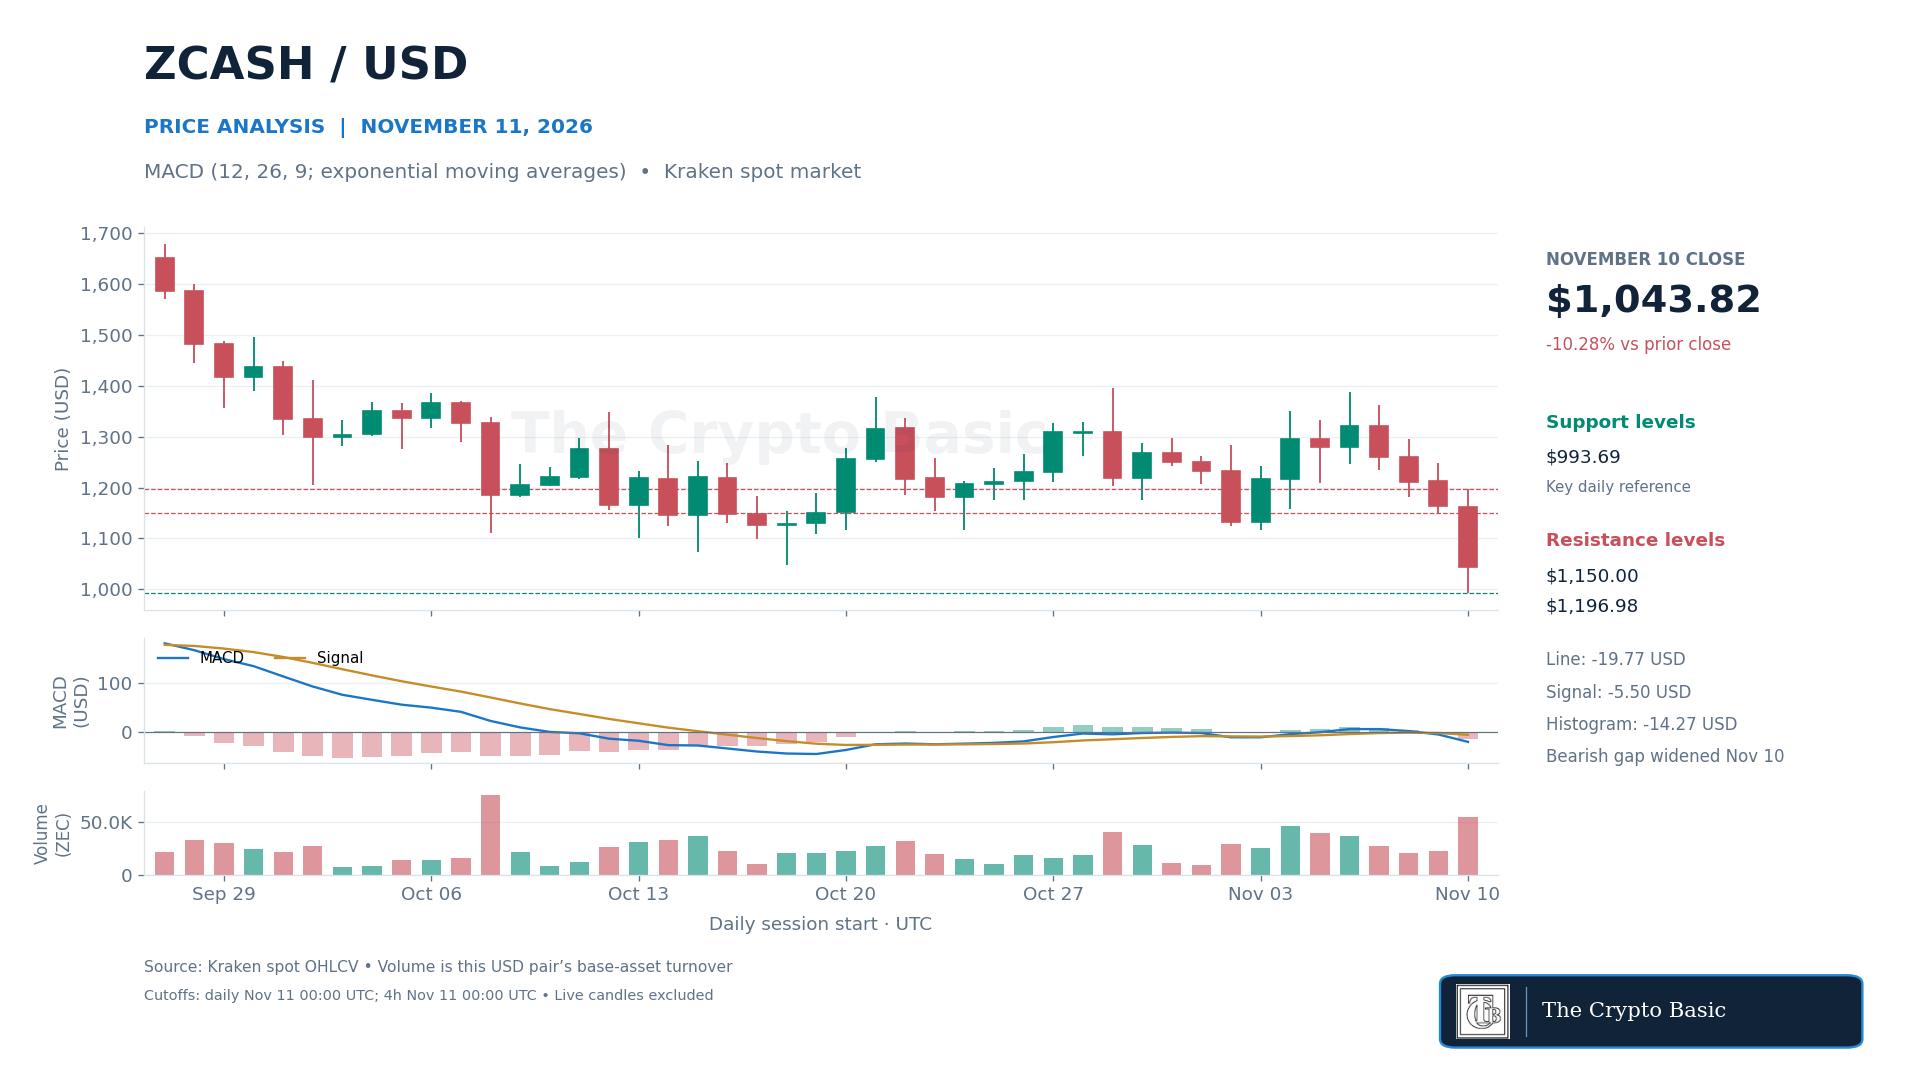
Daily MACD, using 12- and 26-period exponential averages with a nine-period signal EMA, confirmed a bearish line-signal crossover on the completed November 9 candle. The relationship weakened further on November 10: the MACD line fell to −$19.77 against a −$5.50 signal, and the histogram widened to −$14.27 from −$2.93. The completed four-hour histogram was also negative at −$18.81.
Tuesday’s $993.69 low is the immediate support. A daily close below it would confirm a break beneath the latest 60-session range. On a recovery, ZEC first needs to reclaim $1,150, followed by Tuesday’s $1,196.98 high. A close above $1,196.98 would invalidate the immediate breakdown case; until then, rebounds remain below recently lost support.
Hyperliquid decline draws above-average exchange volume
Hyperliquid declined 3.89% on Tuesday to close at $72.23. Its $70.25 low was the weakest price in 60 completed daily sessions. The latest $72.03 price was 7.15% below the $77.58 recorded in our November 6 HYPE analysis.
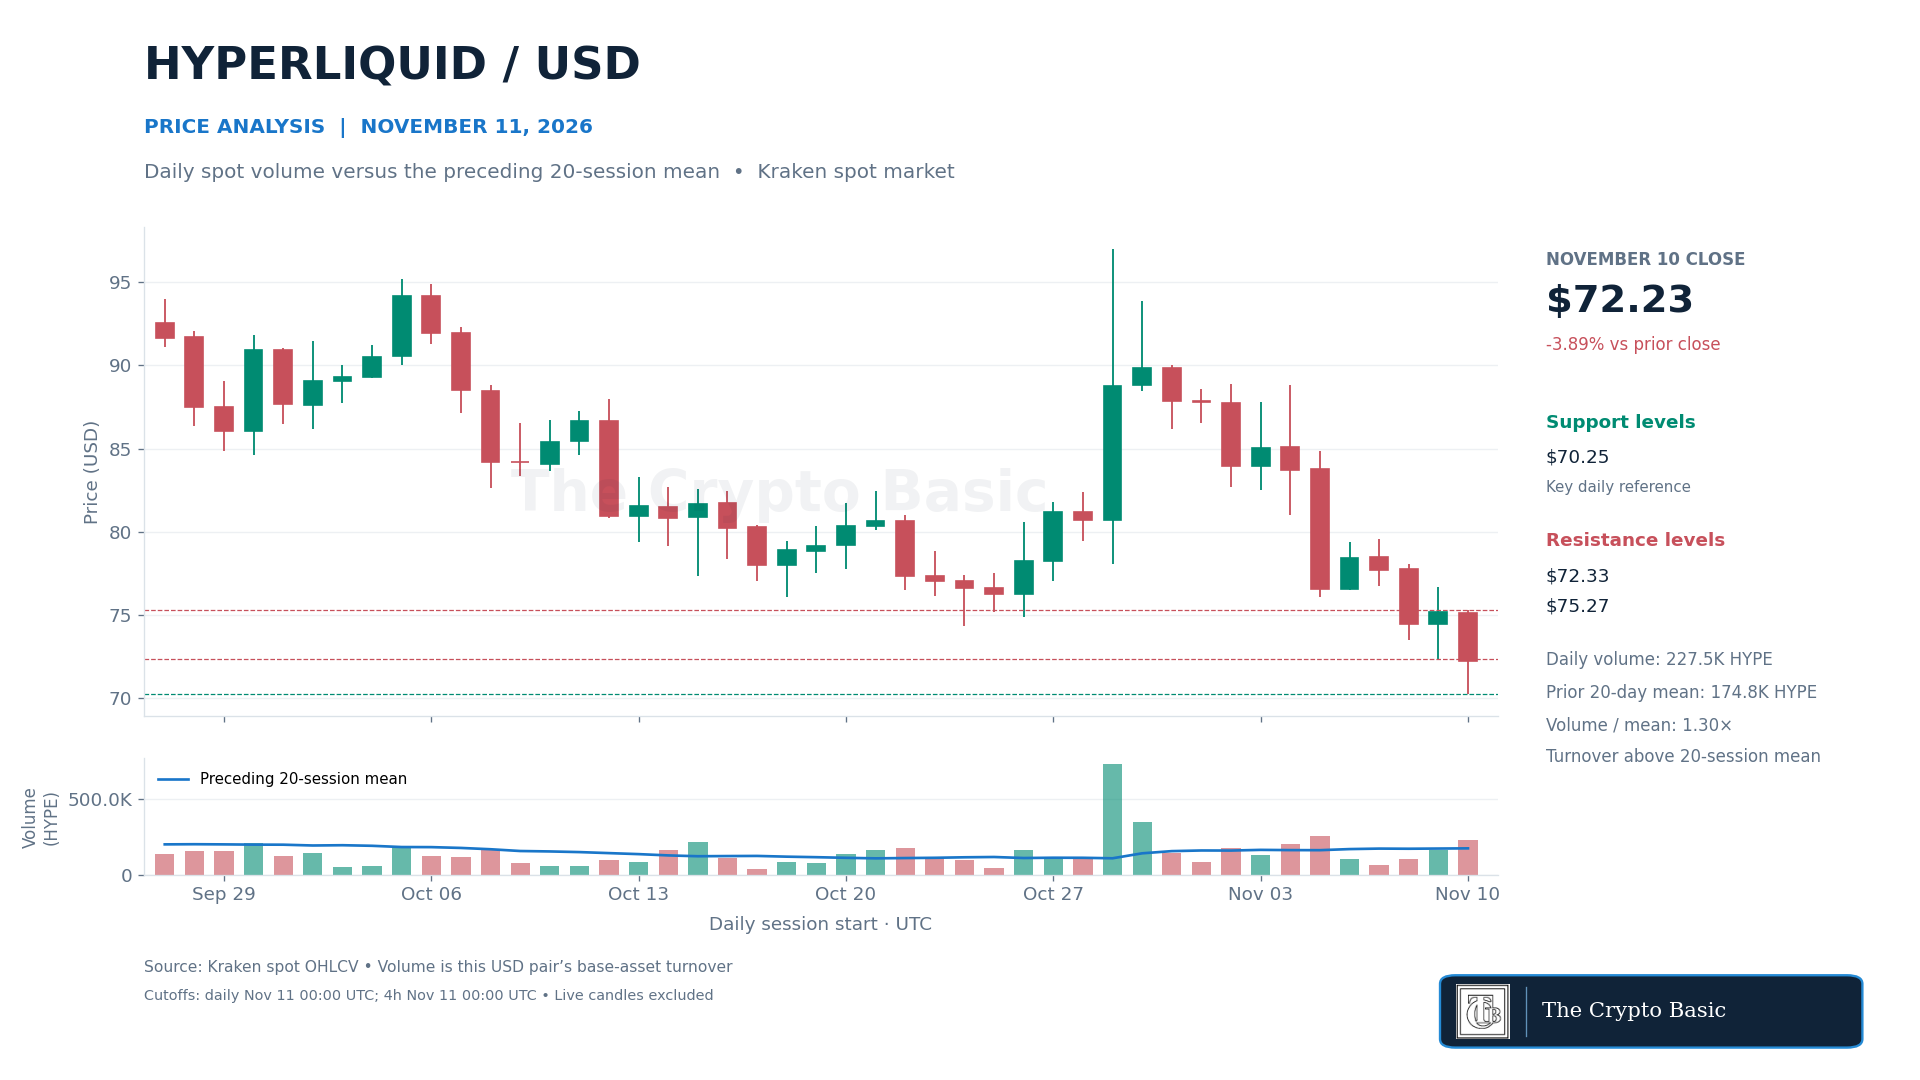
Approximately 227,482 HYPE changed hands in the Kraken spot USD pair, compared with a preceding 20-session average of 174,771 HYPE. Tuesday’s exchange turnover was therefore 1.30 times its recent average. That heavier participation accompanied the decline, but volume alone does not establish that support will break.
The latest completed four-hour candle closed at $71.87. A daily close above $72.33 would recover Monday’s low, while $75.27 is the more meaningful resistance and bearish invalidation level. A close below $70.25 would extend the decline beyond the latest two-month low, with the August 14 low at $55.33 serving as a longer-range reference.
Jupiter holds above its first Fibonacci retracement
Jupiter closed Tuesday at $0.25420, up 0.71%, after holding a $0.25000 low. The latest price rose 3.55% over the past 24 hours, reflecting a later part of the rebound than the completed daily change. The completed four-hour candle ended at $0.26016 after reaching $0.26154.
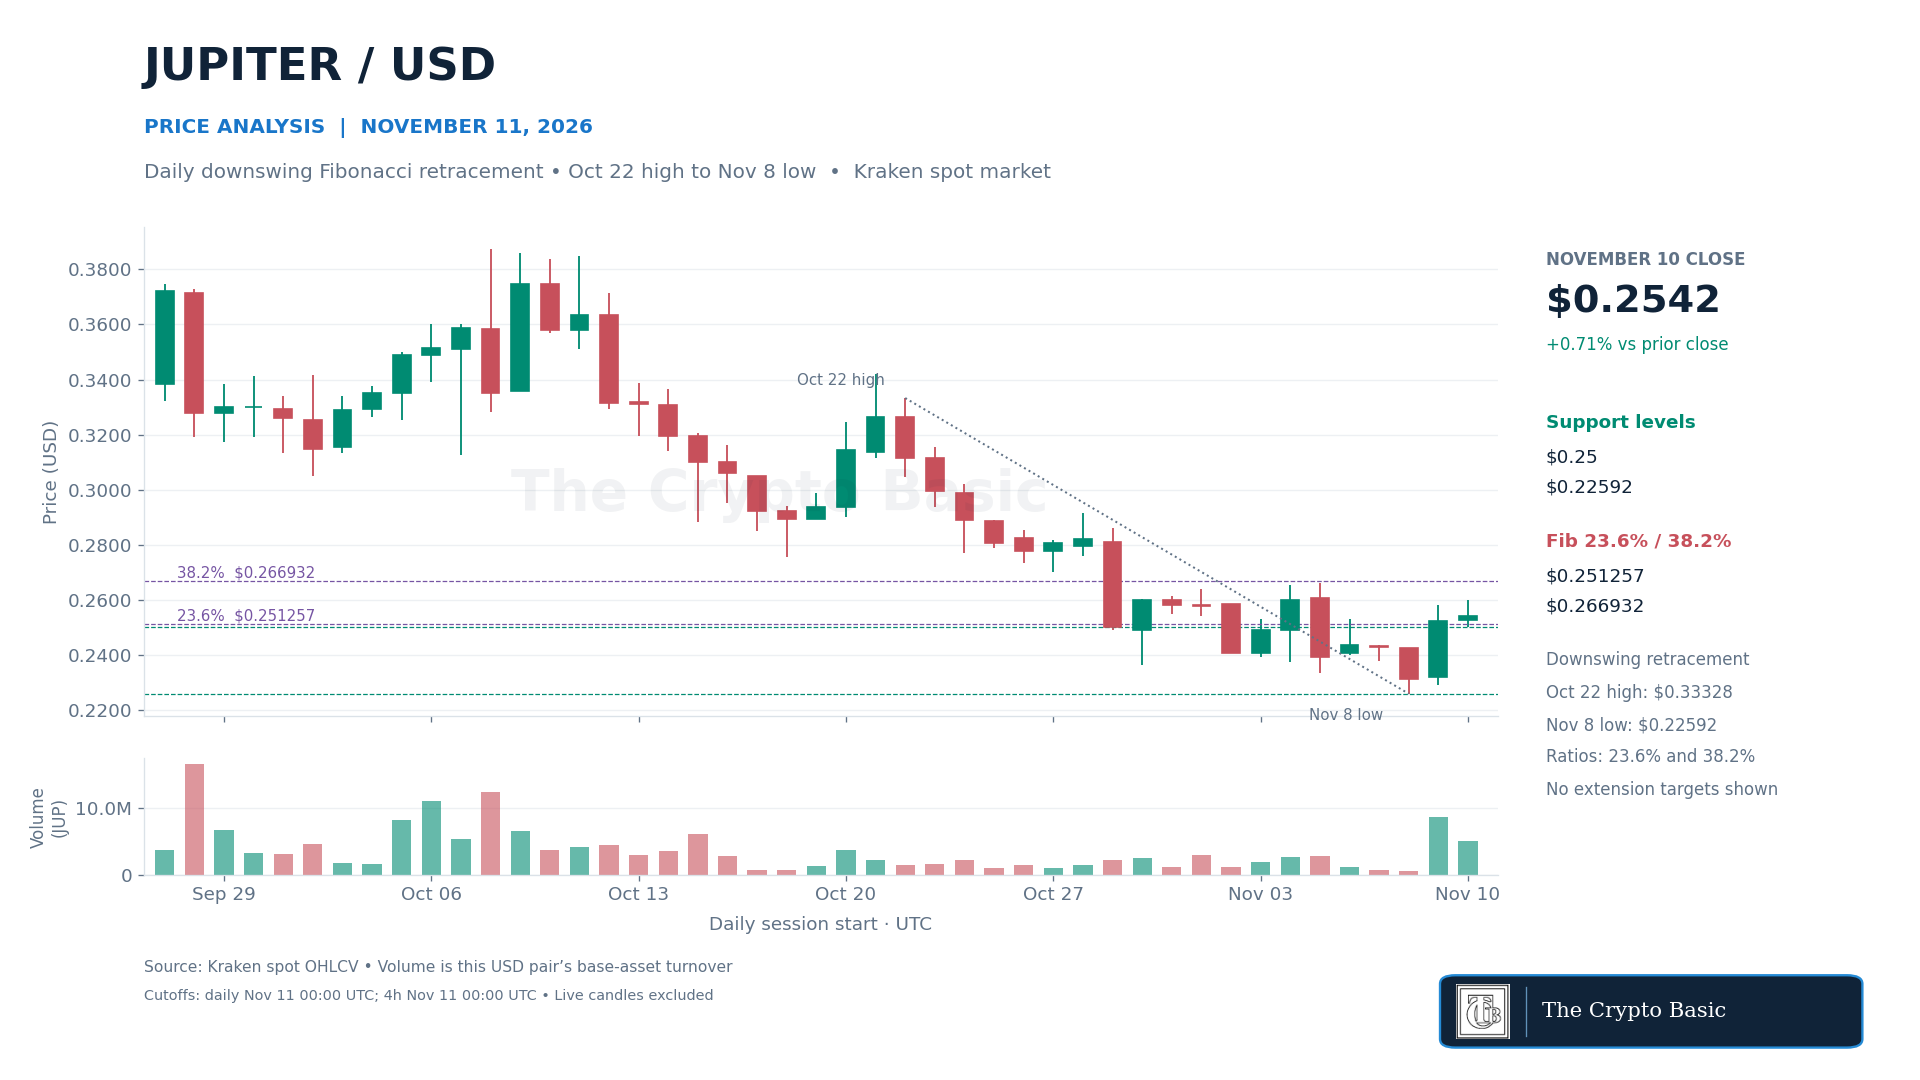
The Fibonacci map measures a prospective recovery of the downswing from the October 22 high at $0.33328 to the November 8 low at $0.22592. The 23.6% retracement is $0.251257, the 38.2% level is $0.266932, the midpoint is $0.279600 and the 61.8% level is $0.292268.
Tuesday’s close held above the first retracement, but neither the completed daily nor four-hour candle cleared $0.266932. A daily close above that level would strengthen the rebound toward $0.279600. Falling back below $0.251257 would weaken the recovery; a close below $0.22592 would invalidate it and confirm a fresh extension of the downswing. The higher Fibonacci levels are conditional resistance, not guaranteed targets.