




Bitcoin’s 50-week moving average has crossed below its 100-week average for the fourth identified time, reviving a pattern that appeared near the lows of three completed market cycles.
The latest crossover occurred in July 2026, shortly after the summer price trough. That places Bitcoin within a familiar historical sequence, although the summer low remains a candidate cycle bottom.
The next stage could take months. In the three earlier episodes, the 50-week average eventually crossed back above the 100-week average approximately nine to 15 months later. Repeating that interval from July would place a potential bullish crossover between April and October 2027.
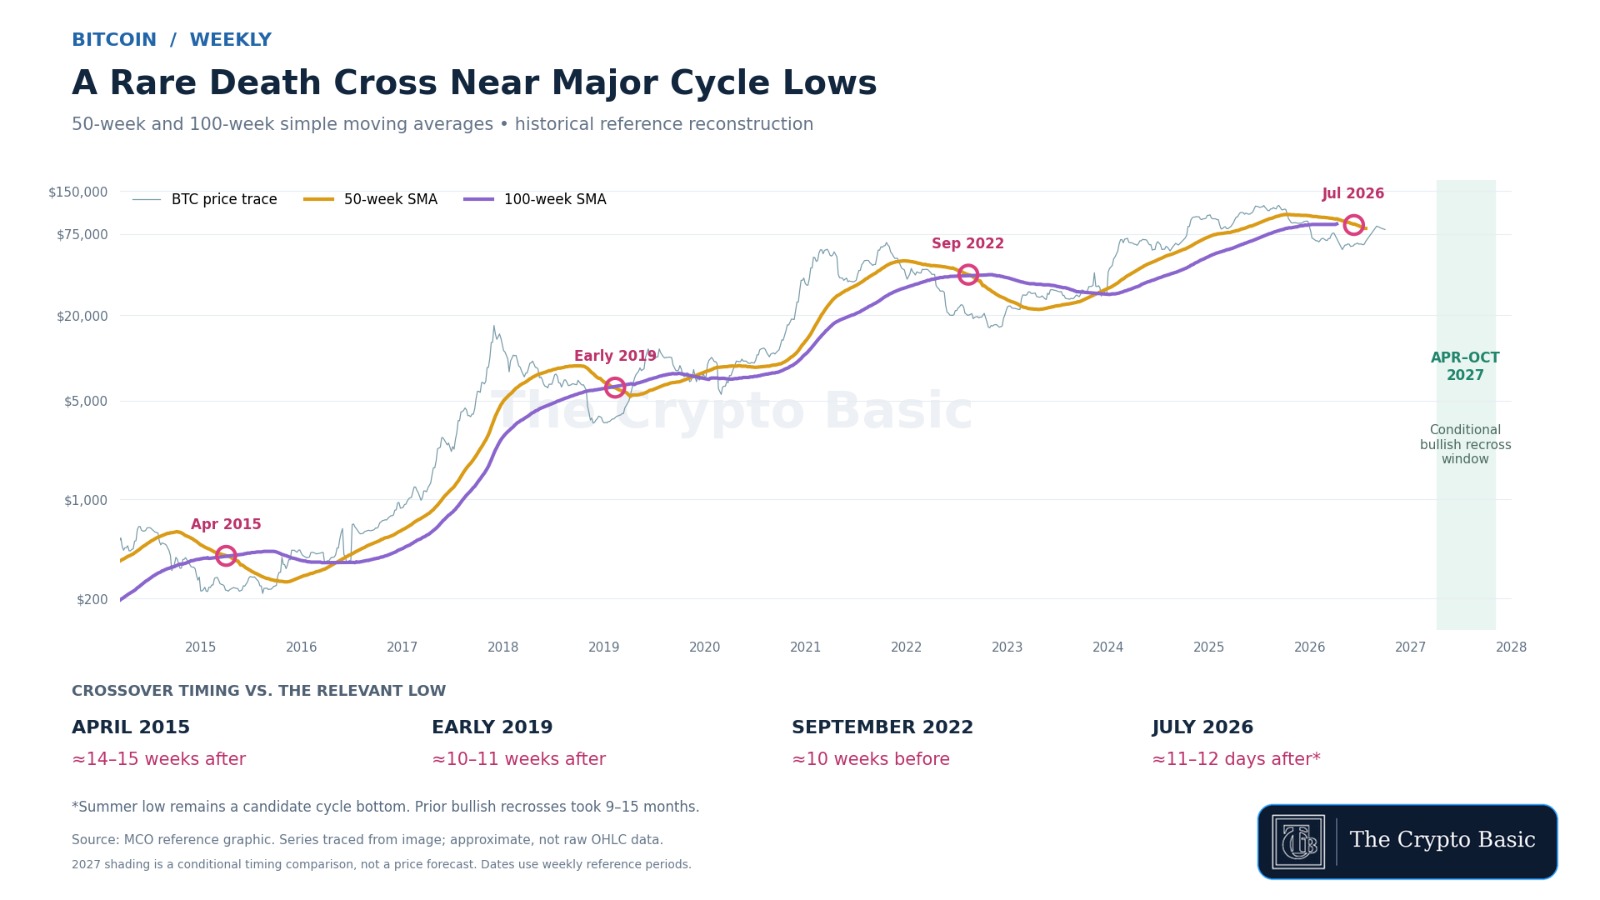
Why This Bitcoin Death Cross Matters
This signal involves simple moving averages of weekly closing prices. The yellow 50-week average reflects roughly one year of trading, while the purple 100-week average covers almost two years.
When the shorter average falls below the longer one, recent prices have weakened enough to pull the shorter-term trend beneath the longer-term baseline. Pink circles mark those bearish intersections, green circles identify subsequent bullish crossovers, and white circles mark the comparison lows.
Both averages respond slowly because they incorporate many months of trading. Consequently, a bearish crossover can occur after Bitcoin has already suffered a substantial decline—and even after price has started recovering from a low.
That delay explains why a technically bearish signal can appear during the later stages of a bear market. The crossover reflects accumulated weakness rather than identifying the exact moment selling pressure ends.
Four Crossovers, but Different Bottoming Sequences
The four identified crossover periods cluster around major lows, but their timing differs:
| Bearish crossover | Approximate relationship to the relevant low |
|---|---|
| April 2015 | 14–15 weeks after the January bottom |
| Late February–March 2019 | 10–11 weeks after the December 2018 bottom |
| September 2022 | 10 weeks before the November bottom |
| July 2026 | 11–12 days after the summer low |
Historical calculations differ slightly on the exact dates, including whether the latest summer trough falls at the end of June or beginning of July. The broader sequence remains consistent: these crossovers developed close to major bottoming periods.
The first two episodes demonstrate the indicator’s delay. Bitcoin had already established its low before the averages crossed, meaning the bearish signal arrived while the market was moving beyond its deepest decline.
September 2022 provides the crucial exception. The crossover appeared before the final bottom, leaving room for another downward leg over the following ten weeks.
That distinction matters for 2026. Proximity to a historical bottoming period does not establish that the latest low will hold. There are three completed historical examples, while the fourth outcome remains unresolved.
Bitcoin Still Needs a Sustained Weekly Recovery
At the reference price near $73,800, Bitcoin sits beneath both weekly averages, while the 50-week average remains below the 100-week average. The moving-average structure therefore remains bearish despite the historical bottoming comparison.
Bitcoin previously achieved a weekly close above its 50-week moving average in September. Its subsequent retreat illustrates why an initial reclaim needs sustained buying support
A stronger recovery would involve sustained weekly closes above the averages, higher price lows, and an eventual upward turn in the 50-week average. Together, those developments would provide evidence that improving price action is beginning to change the longer-term trend.
Bitcoin’s recent retest of long-term support near $74,000 also remains relevant to the immediate recovery attempt. That shorter-term test operates alongside the broader cycle comparison.
A new low beneath the summer trough would invalidate the claim that the summer decline had already established the final cycle bottom.
Historical Recovery Timing Extends Into 2027
The earlier bullish crossovers occurred in 2016, 2019 and 2023, approximately nine to 15 months after their respective bearish signals. Applying that interval to July 2026 produces the April–October 2027 window.
This calculation describes when the moving averages might reverse their order if the historical rhythm repeats. It does not establish a date for Bitcoin to begin rising or reach a particular price.
Price can recover well before the averages cross. As stronger weekly closes enter the calculation and older observations drop out, the 50-week average can gradually catch up with the 100-week average.
Both lines move over time, so the crossover cannot be reduced to one fixed Bitcoin price target. A brief rally would also carry less weight than several months of sustained recovery.
For the bullish interpretation to strengthen, Bitcoin needs to preserve the summer trough and rebuild weekly momentum. The July signal places the market near a historically significant phase, while subsequent price action will determine whether that phase develops into a durable recovery.