


Cardano is currently following an elaborate Elliott Wave structure, with a market analyst expecting the completion of the fifth wave to culminate in a rally to the $6 level.
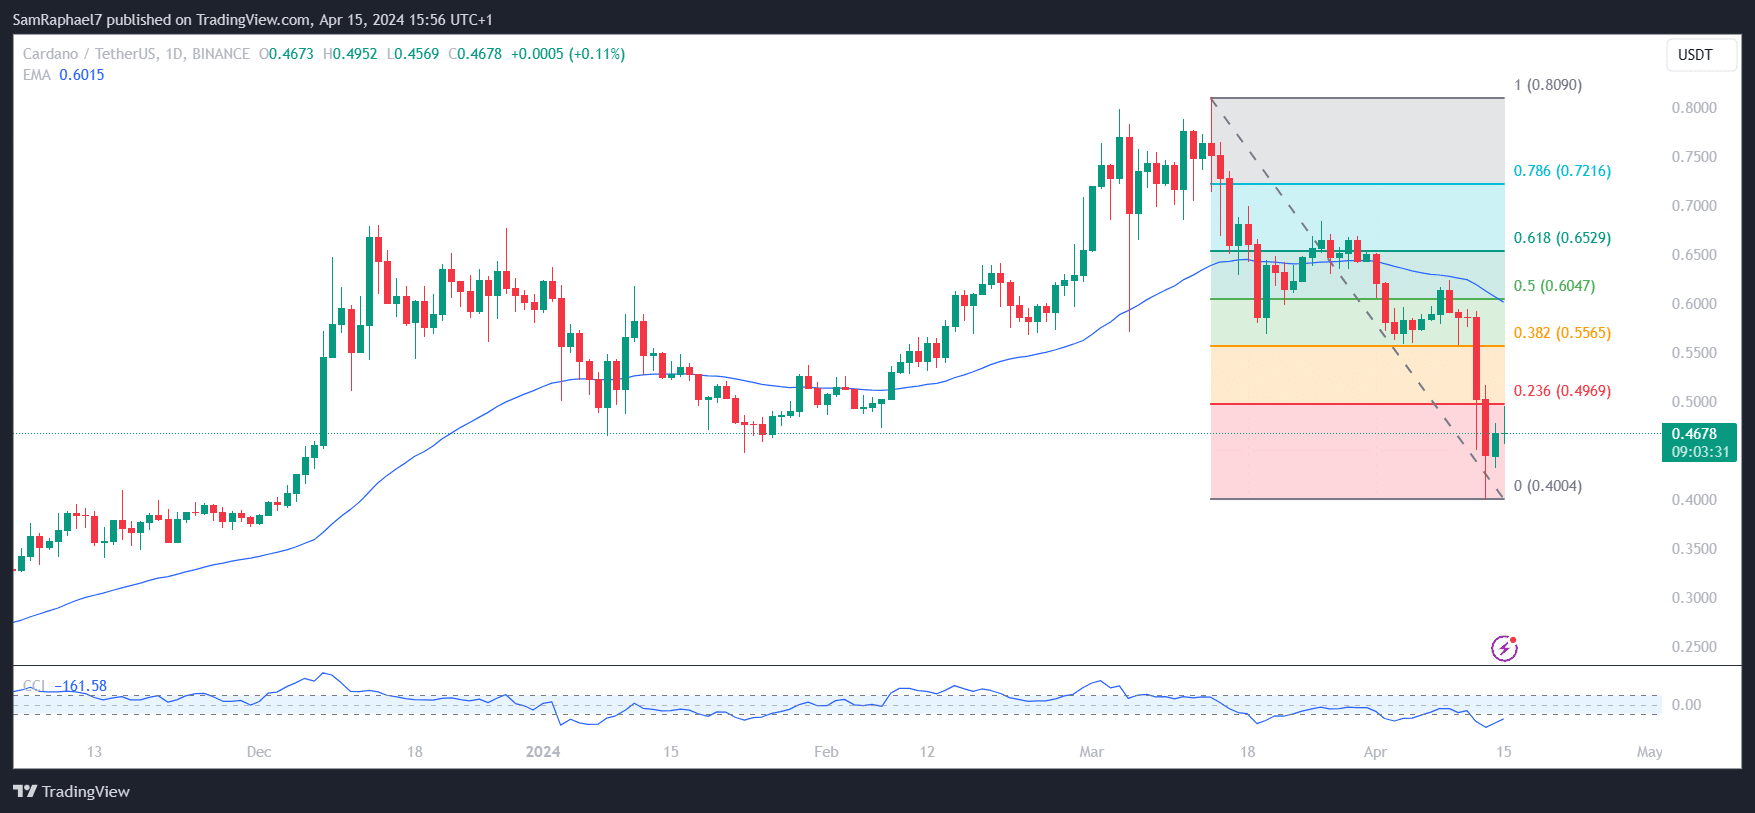
The market-wide turbulence dealt a blow on Cardano’s price action, triggering a collapse below the $0.62 and $0.60 support levels on April 9. ADA showed resilience following this decline, holding above the $0.55 territory on April 10 and 11 despite the strong bearish pressure.
However, the strength of the bulls waned on April 12, leading to a massive 14.19% decline. This marked Cardano’s largest intraday loss this year. ADA broke below the psychological support levels between $0.54 and $0.50, plunging to a new yearly low of $0.45.
Before April 12, the last time Cardano saw $0.45 was last December. Despite recovering from this $0.45 low on April 12, ADA faced another round of bearish shenanigans, eventually relinquishing the $0.40 level to reach the Dec. 1, 2023 lows at $0.3994. Cardano quickly recovered from this level, but continues to trade below $0.50.
Cardano Trades in an Elliott Wave Pattern
Amid the downtrend, a prominent market analyst known as illuminati_KO27 unveiled a TradingView analysis today suggesting that ADA might actually be following a pattern that would eventually result in a bullish breakthrough. He cited historical data to corroborate his claims.
According to the analysis, Cardano is currently trading within the same five-wave Elliott Wave structure it encountered from 2020 to 2021 that culminated in a rally to an all-time high of $3.31. For context, the Elliott Wave pattern began in March 2020, when ADA changed hands at $0.04.
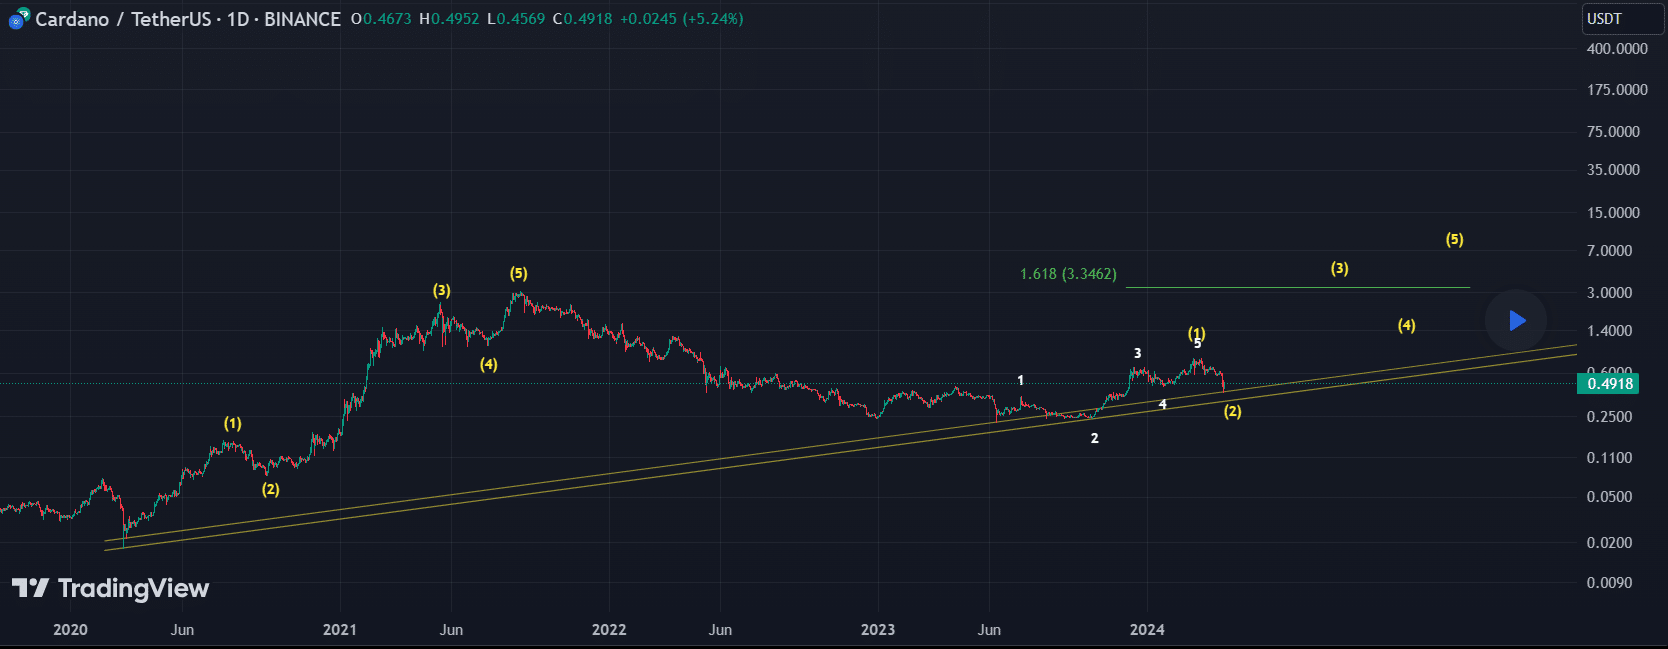
The first wave saw Cardano rise to $0.14 in August 2020 before collapsing to $0.08 during the second wave. Cardano recovered from this decline, surging to $2.47 in May 2021 upon the completion of wave three. The fourth wave saw a mild decline before ADA rose to $3.1 in September 2021 in the fifth wave.
The latest analysis indicates that Cardano is now following this Elliott Wave structure, having completed the first wave when it rose from $0.24 in October 2023 to $0.81 on March 14. However, ADA is now trading in the second wave, featuring the latest downtrend that saw it drop to $0.3994 two days back.
ADA Could Rise to the $6 Level
Once this downtrend ends with the completion of wave 2, the analyst expects the third wave to take Cardano to the $3.4 territory, aligning with the Fibonacci 1.618 level. Data suggests that ADA could face a correction below $2 during the fourth wave and then soar to the $6 price when wave 5 completes.
Cardano currently trades for $0.4729 despite a 6% increase since yesterday, looking to breach the $0.4969 resistance level for a push toward $0.50. From its current position, ADA would need to increase by 1,168% to reach the projected $6 price.
Despite the ambitious nature of the $6 price, some market analysts predict more audacious targets. For instance, Ali Martinez believes ADA has the potential to reach $9 sometime in the future. Chris, a Cardano proponent, presented two possible scenarios this month which could see Cardano hit $7.7 or $9.7.