



The recent performance of Bitcoin has reignited optimism in the crypto market, with even top critics acknowledging the potential for further price uptrends.
Today, Bitcoin briefly reclaimed the $58K price point, hitting an intraday high of $58,041 before encountering resistance. Notably, this impressive rebound comes just four days after reaching a monthly low of $52,598.
From that level to the recently recaptured $58K range, the premier asset has surged by 10.34% in less than a week. This comeback has drawn the attention of Peter Brandt, a veteran technical analyst with nearly five decades of experience.
Peter Brandt Now Bullish Again on Bitcoin, Targets $150K
Brandt shared a chart illustrating Bitcoin’s historical trends, showing how long BTC took to rise from its previous bear market bottom to its all-time high during this ongoing bull run.
Specifically, the chart indicates that Bitcoin spent 73 weeks, or 511 days, to reach an all-time high of $73,734 back in March. It highlighted that a similar duration may be needed before achieving its next peak.
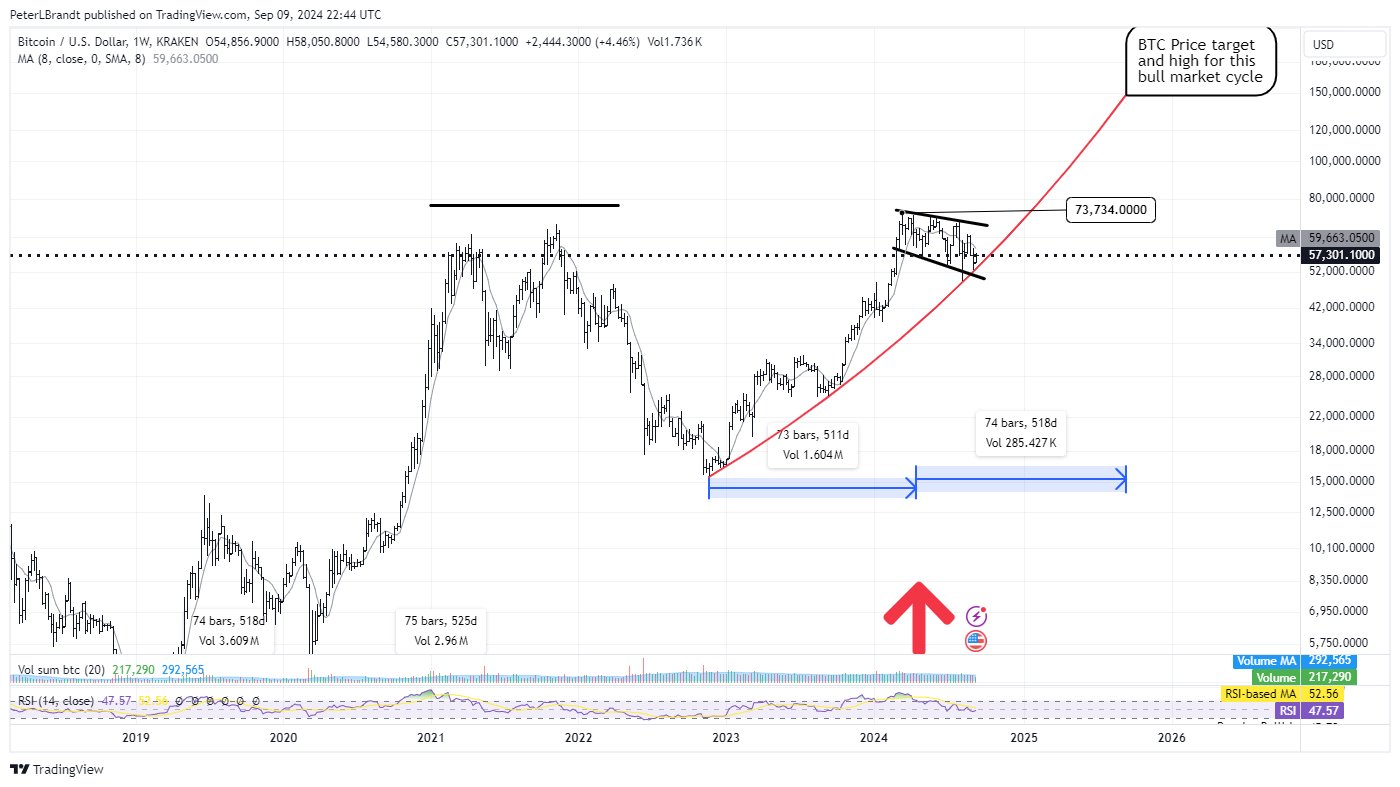
Moreover, Brandt’s chart shows a potential target for Bitcoin around the $150K range. This price target aligns with his previous projections, where he revised his bullish outlook for Bitcoin from $120,000 to $200,000.
It is worth noting that Brandt’s optimistic chart comes just a few weeks after he had consistently issued bearish predictions for Bitcoin.
In one analysis, he forecasted a potential price drop to $48K, claiming Bitcoin might have already reached its peak for this cycle. However, his latest commentary marks a significant shift in outlook.
Factor Supporting the Bullish Outlook
Brandt’s current bullish stance is based on a potential breakout from a classic “Cup and Handle” formation on Bitcoin’s chart. He pointed to this pattern as a strong bullish signal for the leading cryptocurrency.
The “handle” suggests a consolidation phase, and Bitcoin could be poised for a major upward move if it can break through key resistance. Brandt also invited another seasoned analyst, James Roppel, to weigh in on his analysis.
James Roppel, a long-time observer of the Cup and Handle pattern, responded to Brandt’s tweet with enthusiasm, noting that the chart made his “heart race with possibilities.”
While acknowledging the risk of a failed breakout, Roppel remains bullish unless proven otherwise. Accordingly, he identified around $74,000 as a critical price level for Bitcoin Roppel, who is “MAX long” on Bitcoin, cautioned that failure to break through this level could pose a risk.
One market observer commenting on Brandt’s analysis suggested that a successful recapture of the $70K level could propel Bitcoin’s price to $300K.