

A prominent analyst shares significant support and resistance levels to watch for XRP as the asset shows bullish signals despite consolidation.
Amid sustained consolidation, prominent crypto analyst WallStreetBulls believes XRP shows some promising signs on its daily chart. In a recent analysis, WallStreetBulls pointed out bullish indicators for XRP and critical support and resistance levels to closely monitor.
On the daily chart, green arrows have emerged, signaling a potential upward trend for XRP. Green arrows are a technical analysis tool used to identify positive price movements, indicating that the asset might be on the path to bullish territory.
Resistance and Support Levels to Watch
Citing data from the daily chart, the analyst further identified crucial resistance levels that XRP must overcome to sustain its upward momentum. These levels are significant price points where selling pressure is historically strong, potentially causing the asset’s price to stall or reverse.
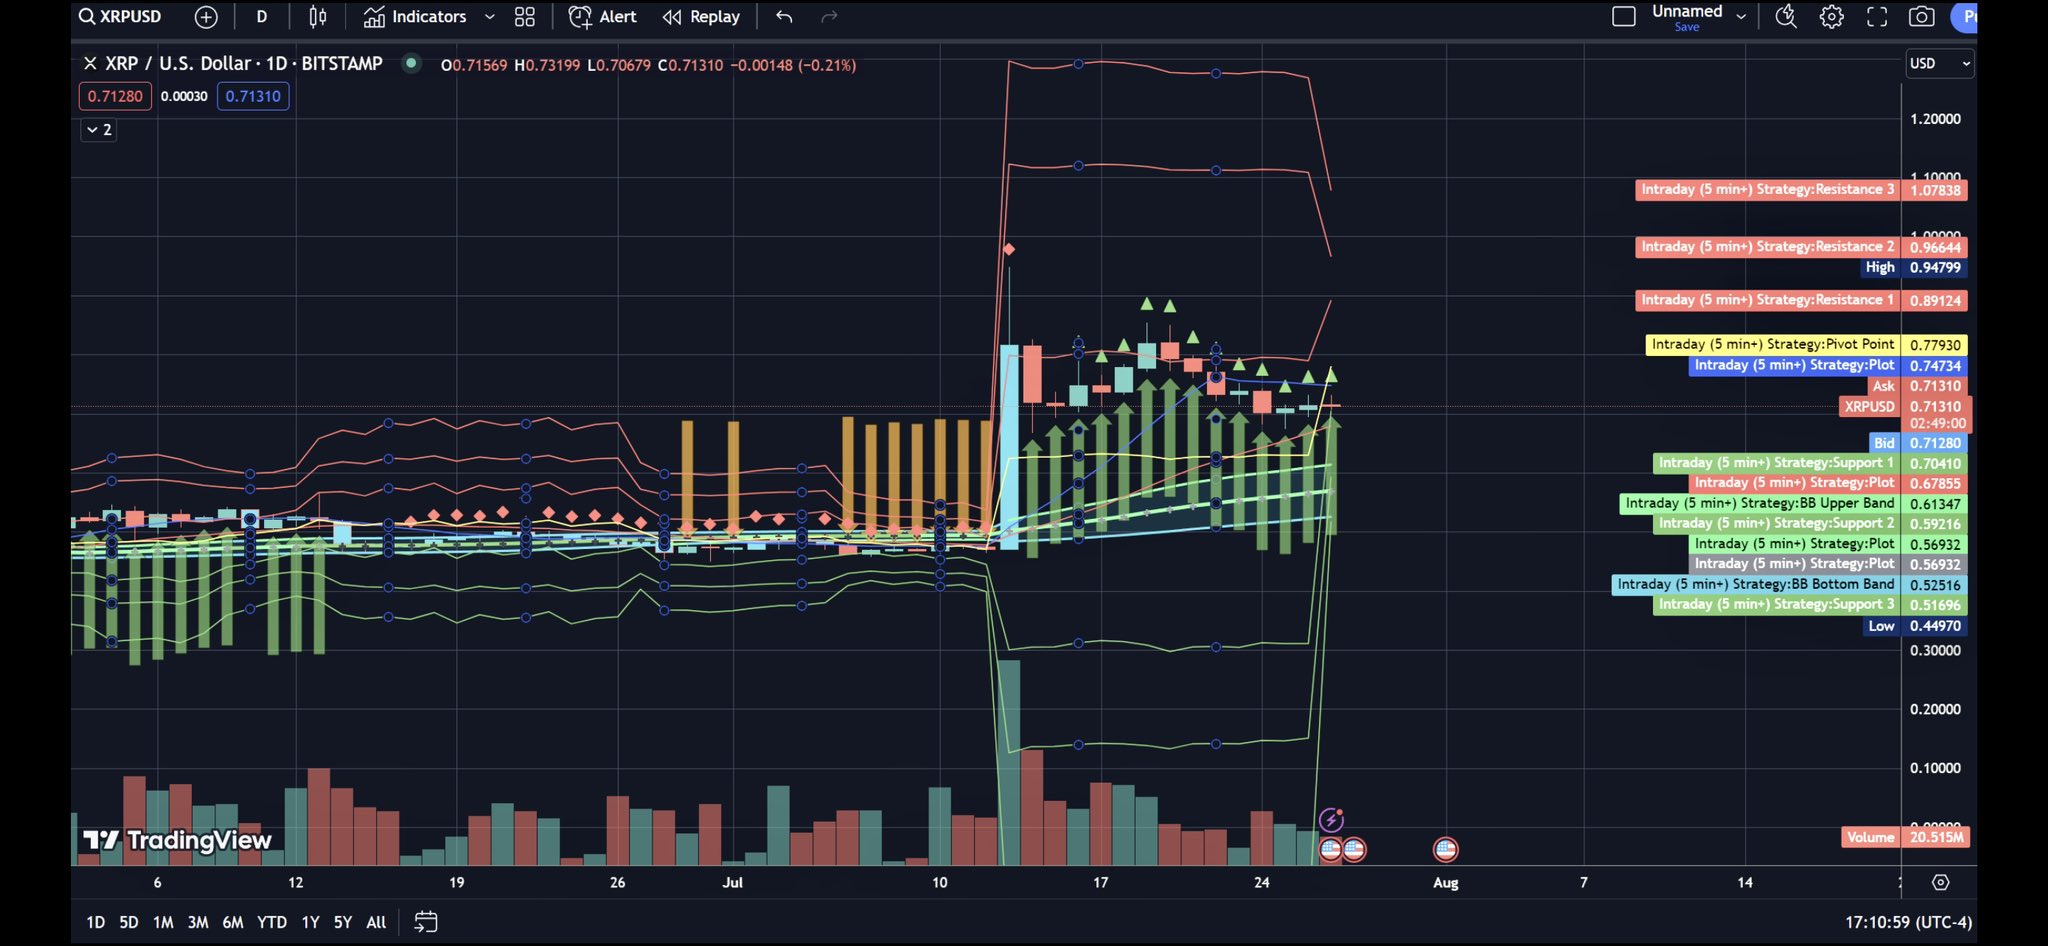
The resistance levels to watch for XRP are $1.08274, $0.96644, and $0.89124. These price points are vital barriers that XRP needs to breach for a sustained bullish trend. However, the last time XRP saw these zones was on July 13, during the astronomical surge triggered by Judge Analisa Torres’ verdict.

Conversely, WallStreetBulls highlighted the support levels that might provide a floor for XRP’s price during a potential downtrend. Per the analyst, the critical support zones currently stand at $0.70410, $0.59216, and $0.51296.
If XRP experiences further dips in its price, these levels may provide support and potentially halt more losses. Following a 0.90% drop today, XRP continues to trade closer to the support at $0.70410.
XRP Enters Overbought Territories
Additionally, the analysis pointed out a crucial pivot point for XRP at $0.77930. Pivot points are significant price levels calculated based on the asset’s previous high, low, and closing prices. They serve as potential turning points in the market.
WallStreetBulls also considered the Bollinger Bands, a tool that measures price volatility. The upper band sits at $0.61347, while the bottom band remains at the $0.52516 price. These levels indicate potential price targets for XRP’s movements.
When the price approaches the upper band, it may signal an overbought condition, while nearing the lower band may indicate an oversold condition. Consequently, at a price above $0.70, XRP has moved into overbought territories, eliciting bearish sentiments.
Responding to the analysis, a Florida-based blockchain enthusiast suggested that the resistance level appeared closer to $0.73 based on recent price action. In response, WallStreetBulls acknowledged the different perspectives of traders and reiterated the importance of staying alert to market changes.
Currently, XRP is trading at $0.7066, experiencing a slight decline over the past 24 hours. Since dropping from $0.7430 four days ago, the asset has faced opposition at $0.73, unable to reclaim the $0.74 territory.
DisClamier: This content is informational and should not be considered financial advice. The views expressed in this article may include the author's personal opinions and do not reflect The Crypto Basic opinion. Readers are encouraged to do thorough research before making any investment decisions. The Crypto Basic is not responsible for any financial losses.