

XRP could be looking to ride a complex structure of multiple Elliott Wave patterns on its journey to clinch new highs above $13.
Chartered market technician Tony “The Bull” Severino disclosed this while speaking on XRP’s current market position in a recent analysis. Notably, XRP has continued to trade at the $0.6 level despite the recent market-wide recovery push.
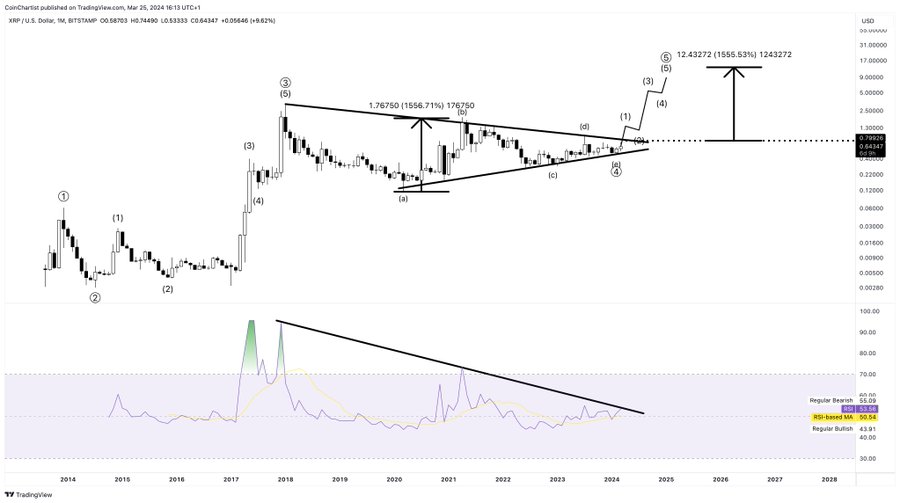
In his analysis, Severino leveraged a monthly chart to illustrate a complex structure of multiple Elliott Wave patterns followed by the crypto asset since 2013. While these patterns have all dictated XRP’s price at various periods, one stands out as relevant for the current price action.
XRP Follows Multi-Year Elliott Wave Pattern
This particular five-wave pattern began in 2013, with XRP concluding the first wave when it rallied to a high of $0.06144 in December 2013. The cryptocurrency met resistance at this high, correcting its previous gains in a collapse to a $0.00478 low in August 2014. This correction marked Wave 2.
Significantly, the start of the third wave coincided with XRP’s recovery from the correction. The asset skyrocketed 69,293% from the $0.00478 low in August 2014 to the all-time high of $3.3170 in January 2018, with this ATH representing the conclusion of the third wave.
However, as Wave 4 began, the market expected to witness another period of correction. When viewed from a zoomed-out perspective, this correction phase extended for six years. Data from Tony’s chart indicates that XRP also formed a symmetrical triangle amid this phase.
The fourth wave concluded last month when XRP reached a price of $0.5036, marking an 84% drop from the $3.31 ATH. The chart suggests that the crypto asset would ride the momentum from the fifth wave, which just began, to record a breakout from the six-year symmetrical triangle.
A Projected $13 Price
This price run is expected to push XRP above the previous all-time high to a price discovery phase. Though this phase would also present corrections and upswings, the general projection is a rally to $13.23, a 1,555% rise from $0.7992, the price at which XRP could breach the symmetrical triangle.
Citing this bullish fundamental, Tony likened XRP to a sleeping giant about to awaken. Significantly, the asset’s monthly RSI has also been in a downtrend, and a price spike from this point could show the RSI breaching the downtrend.
Meanwhile, XRP currently changes hands at $0.6328 as of press time, up 7.81% this month while trading flat over the past week. The token has seen a 12.82% decline in derivatives volume to $1.75 billion in the last 24 hours, with Open Interest (OI) dropping 4.66% to $993 million.
DisClamier: This content is informational and should not be considered financial advice. The views expressed in this article may include the author's personal opinions and do not reflect The Crypto Basic opinion. Readers are encouraged to do thorough research before making any investment decisions. The Crypto Basic is not responsible for any financial losses.