

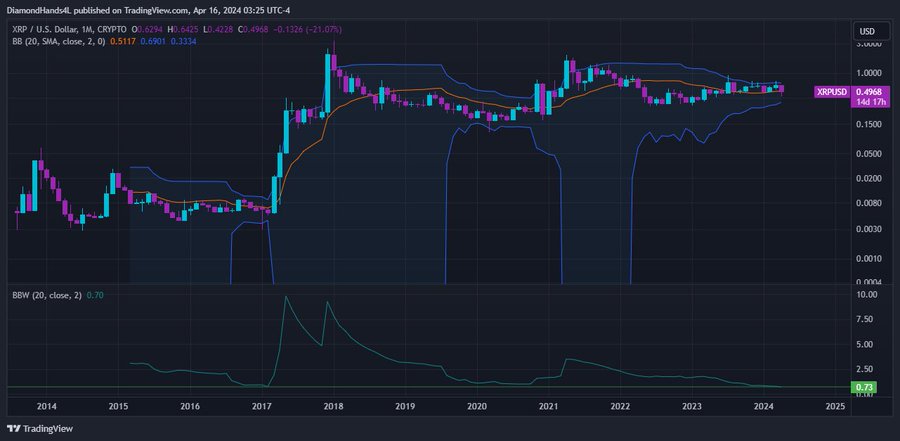
According to crypto analyst Charting Guy (CG), XRP monthly Bollinger Bands (BBs) have reached a historical record-breaking range at a width of 0.70—the tightest they have been since hitting 0.73 in 2017.
$XRP monthly bollinger bands are now the tightest they’ve ever been in history‼️
0.70 for the width
the tightest it got before this was 0.73 in 2017.. 1 month before 📈🚀
probably nothing.. pic.twitter.com/SDk8Q2jj3F
— Charting Guy (@ChartingGuy) April 17, 2024
When the XRP monthly BBs previously reached the 0.73 level in February 2017, it preceded a significant price surge from a low of $0.005 that month to the all-time high of $3.3 in January 2018, marking a 65,900% upsurge in a year.
What This Tells Us
The analytical BBs indicator is a popular tool employed by traders that helps determine how volatile a market price is for any given asset. The wider the range of the BBs indicator, the more volatile the market price.

However, as in the case of XRP’s monthly BBs, the narrowing of this range indicates a reduction in volatility and, often, a breakout to the upside.
At a range of 0.70 — surpassing the lowest and tightest range it has been since the previous breakout to the upside — the BBs indicate XRP may be set for a significant rise in price.
XRP Price Market Sentiment
Shortly after CG presented his charts on X, the community market sentiment varied in response to the analysis. Community concerns included the possibility of a price breakout in either direction and apprehensions of a possible dump.
CG responded to both concerns by stating that the upward slope of the 20 SMA (depicted by an orange line) strongly indicates a potential breakout to the upside.
Here, CG is referring to the 20-day Simple Moving Average (20 SMA), an indicator that calculates the average price over 20 days. With the 20-SMA moving upward, it suggests that average daily closing prices are progressively increasing, indicating an uptrend in price.
What To Expect
The narrowing of the BBs to historical all-time lows (ATLs) for XRP price is indicative of minimal volatility in price, but it should be considered carefully. As just one indicator of expected volatility, it should be considered against ongoing events.
Amid the Israel-Iran conflict, the Ripple vs. SEC lawsuit, and general market volatility incited by geopolitical tensions, indicator signals may not be reflective of future market expectations.
DisClamier: This content is informational and should not be considered financial advice. The views expressed in this article may include the author's personal opinions and do not reflect The Crypto Basic opinion. Readers are encouraged to do thorough research before making any investment decisions. The Crypto Basic is not responsible for any financial losses.