Recent research conducted in Japan suggests XRP may be heading toward a period of heightened volatility in Q4 2024.
XRP community figure Eri spotlighted the report on X, confirming that it emanated from blockchain firm HashHub. Data from the research, based on historical market behavior, suggests that this increased volatility could lead to a significant price push.
Stability Observed Across 2023 and 2024
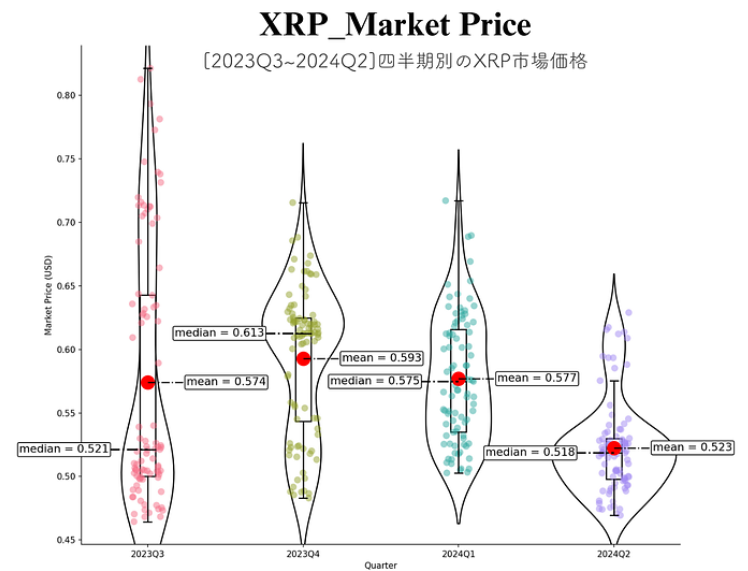
The research highlights XRP’s relative stability throughout 2023 and the first half of 2024. Violin plots used in the study demonstrate that XRP’s market price maintained strong support levels during this period, particularly around the $0.52 mark.
Despite fluctuations, the cryptocurrency has shown resilience, with prices holding firm above these key levels. In Q3 2023, XRP had a mean price of $0.574 and a median price of $0.521.
However, the mean increased to $0.593, while the median reached $0.613 in Q4 2023, indicating a stronger bullish trend. This marked a period of increased volatility for XRP, leading to rapid price spikes.

Meanwhile, in Q1 2024, the mean and median prices slightly adjusted to $0.577 and $0.575, respectively, as consolidation emerged. For Q2 2024, a downward trend emerged, with the mean price falling to $0.523 and the median to $0.518, indicating a loss of momentum.
Possible Rise in Volatility Could Trigger XRP Rally
This data points to a general pattern of stability, with XRP managing to hold above crucial support levels. However, if the pattern repeats itself, the last quarter of 2024 could see a shift in this stability.
Historical data supports this prediction, showing that when XRP entered periods of increased volatility in the past, substantial price movements followed. For instance, in Q3 2023, XRP saw a surge in both the mean and median prices, which was preceded by a noticeable increase in volatility.
Data from Santiment bolsters this sentiment. Notably, a rise in XRP’s 4-week volatility has historically coincided with a price spike. In December 2017, this metric rose to 0.62, leading to XRP’s monumental increase. In April 2021, it surged to 0.47, coinciding with an XRP price rally to $1.96.

XRP Weekly Chart and Historical Volatility
Further supporting the potential for a price surge is XRP’s weekly Historical Volatility (HV). The HV indicator measures how much the price of XRP fluctuates over time. The chart shows that XRP’s HV remains at a low level. However, historical data indicates that whenever this volatility spikes, it often precedes a price increase.
For instance, in September 2022, a sharp rise in XRP’s HV led to a 37% price jump within just one week. A similar pattern occurred in July 2023, when XRP rallied by 59% over the course of a week following another spike in HV.

Meanwhile, the Chande Kroll Stop also shows that XRP is currently in a neutral position. However, any significant market move could trigger a new trend that is in sync with the predictions for increased volatility later in the year.
DisClamier: This content is informational and should not be considered financial advice. The views expressed in this article may include the author's personal opinions and do not reflect The Crypto Basic opinion. Readers are encouraged to do thorough research before making any investment decisions. The Crypto Basic is not responsible for any financial losses.


