Market commentators continue to project bullish targets for XRP for the ongoing market cycle despite the prevalent underperformance.
In a recent analysis, a prominent market analyst, Spectre, set a bullish price target of $10 for XRP within the current market cycle. However, this target comes with a caveat—Spectre remains cautious, noting that the situation will become clearer as the cycle progresses.
A Bullish $10 Target
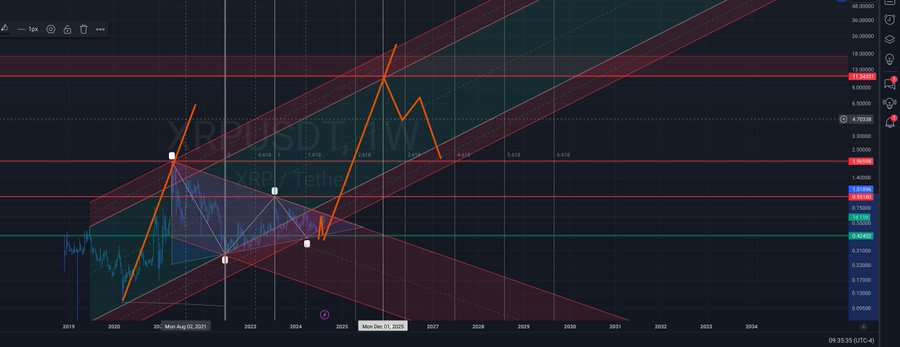
An accompanying chart presented shows a web of patterns and trend lines, each contributing to the overall outlook.

Over the past few years, XRP has displayed volatility, featuring sharp rises and steep corrections. The price movements have formed a symmetrical triangle since 2021, indicating an extensive consolidation phase. Multiple analysts have called attention to this symmetrical triangle in previous analyses.
Spectre expects XRP to eventually break out of this triangle in the current market cycle. Using an orange line, he illustrated an expected parabolic rise.
This line intersects with key Fibonacci levels, including 1.618 and 2.618, which are often considered critical in determining potential resistance and support areas. The projection suggests that XRP could reach a price near $5.61, and subsequently $10.
However, it’s important to note that the chart also indicates potential retracement levels. It spotlights lines that could act as significant barriers to XRP’s ascent. The first resistance level appears near $1.96, a point XRP has struggled to surpass in the past. Beyond this, $4.70 emerges as a critical level to watch.
XRP Shows Weak Bullish Momentum
Meanwhile, as of the latest data, XRP changes hands at $0.5968. It currently trades above the middle Bollinger Band, or the 21-day moving average (MA), which stands at $0.5857. This position suggests a moderately bullish trend.

However, XRP remains below the upper band at $0.6236, indicating that while the price is trending upwards, it has not yet reached overbought conditions. The lower band at $0.5478 acts as support, and as long as XRP remains above this level, the bullish sentiment is likely to persist.
In addition, the DMI indicator shows a +DI at 23.91 and a -DI at 18.15. A higher +DI compared to -DI indicates that the bulls are currently in control. However, the ADX line, which measures the strength of the trend, is relatively low at 15.33. This low ADX reading suggests that the current trend, although positive, is not particularly strong.
DisClamier: This content is informational and should not be considered financial advice. The views expressed in this article may include the author's personal opinions and do not reflect The Crypto Basic opinion. Readers are encouraged to do thorough research before making any investment decisions. The Crypto Basic is not responsible for any financial losses.


