A pseudonymous market analyst believes XRP is on the verge of reaching a price discovery phase amid the formation of a multi-year pennant.
The analyst, known simply as “Ahm” on social media, believes this technical pattern, when combined with the Elliott Wave theory, indicates a strong likelihood of a breakout that could propel XRP prices to a range of $5-$6.
XRP Multi-Year Pennant Formation
In the chart, Ahm identified a large-scale symmetrical triangle or pennant pattern, which has been developing over several years. Per visual data from the chart, this pattern features converging trendlines that trap the price action in a narrowing range.
XRP fell into the pattern following the drop from the $3.31 all-time high in January 2018. Data confirms that it has been coiling within the boundaries of this pennant, with the upper trendline acting as strong resistance, while the lower trendline has provided solid support.

Several analysts have also pointed out this long-standing pattern. Interestingly, Ahm’s chart shows XRP’s volume profile within this pattern has also been gradually decreasing. This is a typical occurrence in pennant formations, as the market anticipates a breakout.
The Elliott Wave Pattern
The analysis also incorporates Elliott Wave theory. In the XRP chart, Ahm identifies a completed ABC correction pattern, which suggests that it is now on the verge of entering a new impulsive phase.
This potential fifth wave could push XRP to significant highs. Ahm pointed out that while $4 is an immediate area of interest, the confluence of chart patterns and wave analysis suggests that XRP could push higher toward the $5-$6 range.
The target range is in alignment with the expected measured move from the pennant’s breakout point. However, the analyst warns that the breakout is not guaranteed and that traders should watch closely for confirmation.
XRP Macro Breakout
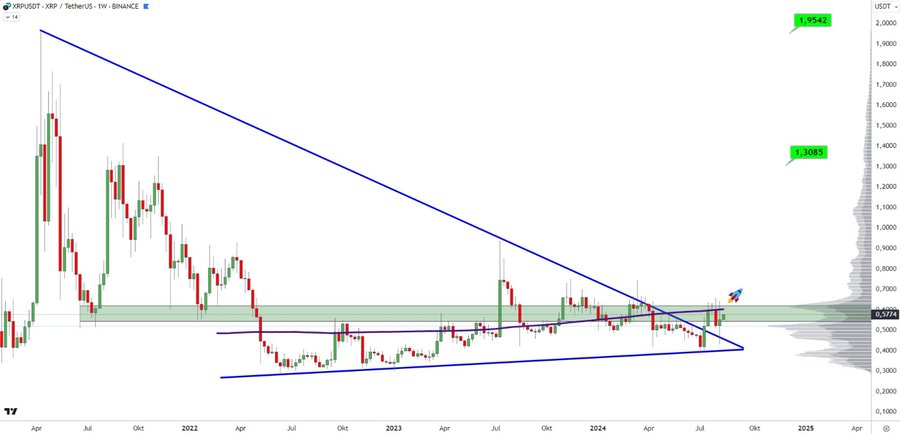
Meanwhile, Flash, another market analyst, presented a more immediate analysis of XRP’s price action. Flash’s chart shows that XRP has already broken out of its macro downtrend, which had been in place since the drop from $1.96 in April 2021.

The breakout point from this downtrend appears to be near the $0.55-$0.57 range, where XRP has managed to hold above an important support level. Flash pointed out that the 200-week moving average (200WMA) is the last significant hurdle before XRP can target $2.
Overall, the analyses from both market watchers set up targets of $2, $4, $5 and $6. However, currently trading for $0.5907, XRP must first breach crucial resistance levels to have a go at these targets. Notably, the first resistance rests on the $0.93 point, aligning with the July 2023 peak.
DisClamier: This content is informational and should not be considered financial advice. The views expressed in this article may include the author's personal opinions and do not reflect The Crypto Basic opinion. Readers are encouraged to do thorough research before making any investment decisions. The Crypto Basic is not responsible for any financial losses.


