


Bitcoin tests the 200D-SMA for the third time since August, with analysts monitoring for a potential bullish breakout.
After briefly dipping below $63,000, Bitcoin’s resurgence toward $64,000 has sparked renewed interest, particularly as it confronts a critical technical level: the 200-day Simple Moving Average (200D-SMA).
200D-SMA: A Persistent Barrier
According to an observation by Ali Martinez, an expert analyst, the 200D-SMA has proven to be a significant resistance level for Bitcoin. In mid-August, the first test of this moving average resulted in a rejection, causing a subsequent price decline. This showed its role as a formidable barrier.
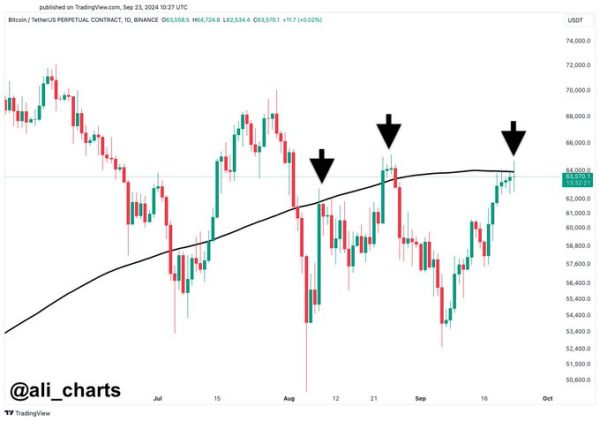
A second test in late August to early September saw another rejection, as Bitcoin struggled to break through this technical hurdle.
Now, with Bitcoin once again testing the 200D-SMA in mid-September, analysts are cautious yet hopeful. Per Martinez, a successful break above this level could signal a potential bullish shift, marking a crucial turning point for the crypto’s short-term outlook.
Parallel Market Trends
In yet a separate bullish post by Martinez, the analyst’s observations reveal notable parallels between Bitcoin and other major assets like Gold and the S&P 500.
Both assets have recently exhibited bullish trends following extended periods of consolidation, suggesting a similar trajectory could unfold for Bitcoin.
I wonder if gold and the S&P500 are trying to tell us something about #Bitcoin…. 👀 pic.twitter.com/Ws68XlVjCK
— Ali (@ali_charts) September 23, 2024
Gold’s price surged from $2,300 to over $2,620 after consolidating within a defined range, propelled by strong buying interest. The S&P 500 displayed a similar pattern, breaking out after a consolidation phase and posting significant gains.
Bitcoin’s current price movement, which has fluctuated between $53,500 and $72,000, hints at potential upside if it can overcome its key resistance near $70,000.
Bullish Flag Observed
Further supporting a bullish outlook, technical indicators point to strengthening market dynamics.
John Bollinger, known for the Bollinger Bands, identified a promising pattern on Bitcoin’s weekly chart. A W-shaped formation, nestled within a downward-sloping regression channel, has emerged, often interpreted as a flag pattern.
This setup typically indicates market consolidation before a continuation of the prior trend. The price has oscillated within the channel, finding support near the lower band, which has led to a bounce back, highlighting robust buying pressure at these levels.