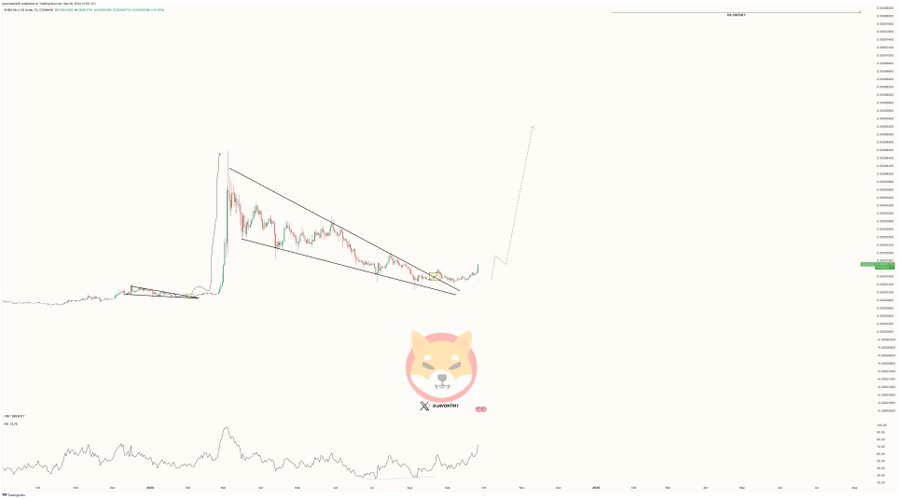
Shiba Inu (SHIB) is showing strong bullish signals after breaking out of a falling wedge pattern, as observed by market analyst Javon Marks.
The breach of the falling wedge has led Marks to suggest that SHIB could be heading toward an ambitious target of $0.000081. This level would mark an impressive 326% price increase from Shiba Inu’s current levels.
Falling Wedge Breakout
The falling wedge pattern often signals that an asset is witnessing the end of a downtrend and the beginning of a bullish reversal. The pattern features two converging lines whose distance narrows overtime, as the market awaits a breakout.
Shiba Inu started forming the falling wedge after it dropped from the $0.000045 yearly peak in early March. As prices retraced, Shiba Inu witnessed lower lows and lower highs, forming two lines that ultimately converged as the bulls started reclaiming control of the market.

SHIB broke out of the channel late last month, suggesting that a major price reversal could be underway. After the breakout, Shiba Inu witnessed another mild correction, eventually retesting the upper trendline. Nonetheless, this retest allowed the bulls to recover strength for another push.
Marks noted that SHIB has shown strength after breaking out of the wedge formation, with the current price action being potentially just the beginning of a larger move. He projected that SHIB could rally by over 326% from its current levels to a price target of $0.000081.
However, it’s important to note that while the breakout is promising, Shiba Inu will need to maintain its bullish momentum to reach the ambitious target.
Shiba Inu Shows Strength
Meanwhile, after retesting the upper trendline of the wedge, Shiba Inu has recorded massive upward movement, having closed yesterday with an impressive 22% gain. This marked its largest intraday gain in over six months.
The surge allowed SHIB to climb to $0.000019, the highest level it has reached since July. As Shiba Inu knocks at the $0.00002 mark, the daily chart reveals that SHIB has now broken above the Keltner Channel.

Notably, a breach above the upper band of the Keltner Channel typically signals that the asset is overbought. However, it also suggests strong upward momentum, indicating that the current bullish trend may continue for some time.
Additionally, Shiba Inu’s directional momentum indicators further support the idea of a continued rally. The Directional Movement Index (DMI) shows that the +DI has risen sharply to 41.753, while the -DI has dropped to 8.114, indicating that buying pressure is overwhelming selling pressure.
Moreover, the Average Directional Index (ADX) has risen to 29.3. An ADX reading above 25 shows that the current trend is strong. Shiba Inu currently trades for $0.00001917, up 21% in the past 24 hours.
DisClamier: This content is informational and should not be considered financial advice. The views expressed in this article may include the author's personal opinions and do not reflect The Crypto Basic opinion. Readers are encouraged to do thorough research before making any investment decisions. The Crypto Basic is not responsible for any financial losses.


