

Solana retests its breakout level at $124 after a 2.55% drop. A rebound could push prices to $150, but one analyst signals the risk of a fall to $65.
Following a failed recovery attempt this week, altcoin prices have dipped, bringing Solana back to a market price of $124. The SOL price dropped 2.55% on April 15, fueling a 1.66% intraday decline.
Currently, Solana is taking support from a key moving average line, hinting at a potential reversal. Could this propel the SOL price back to $150?
Solana Price Analysis Reveals 20% Upside Potential
Solana’s price action confirmed a bullish breakout of an inverted head-and-shoulders pattern on the 4-hour chart on April 12. The breakout rally peaked near the $135 mark before encountering significant overhead resistance.

Bearish pressure near $135 resulted in multiple long-wick candles, with prices finding support at the 200 EMA line. Additionally, the 38.2% Fibonacci level at $128 reinforced the bullish floor alongside the 200 EMA.

However, a broader market pullback has dragged the SOL price below $128. Currently, the downturn holds above the 50 and 100 EMA lines. Notably, a recent bullish crossover between the 50 and 100 EMAs suggests a short-term upward momentum.
Interestingly, Solana’s pullback appears to be a retest of the inverted head-and-shoulders breakout. The SOL price has completed the retest near the neckline at $124.
Despite the potential for a bullish reversal post-retest, the MACD indicator signals a sell. The MACD and signal lines are trending downward toward the zero line following a bearish crossover.
Based on Fibonacci levels, a successful post-retest reversal could push Solana past the 50% Fibonacci retracement level, targeting the $150 zone—an upside potential of nearly 20%.
Alternatively, a breakdown below $124 could lead to a test of the $116 support level or the psychological $100 mark.
Solana Records All-time High Total Monthly Active Wallets
Despite the short-term pullback in Solana prices, the number of active addresses on the Solana network has increased to 3.94 million.

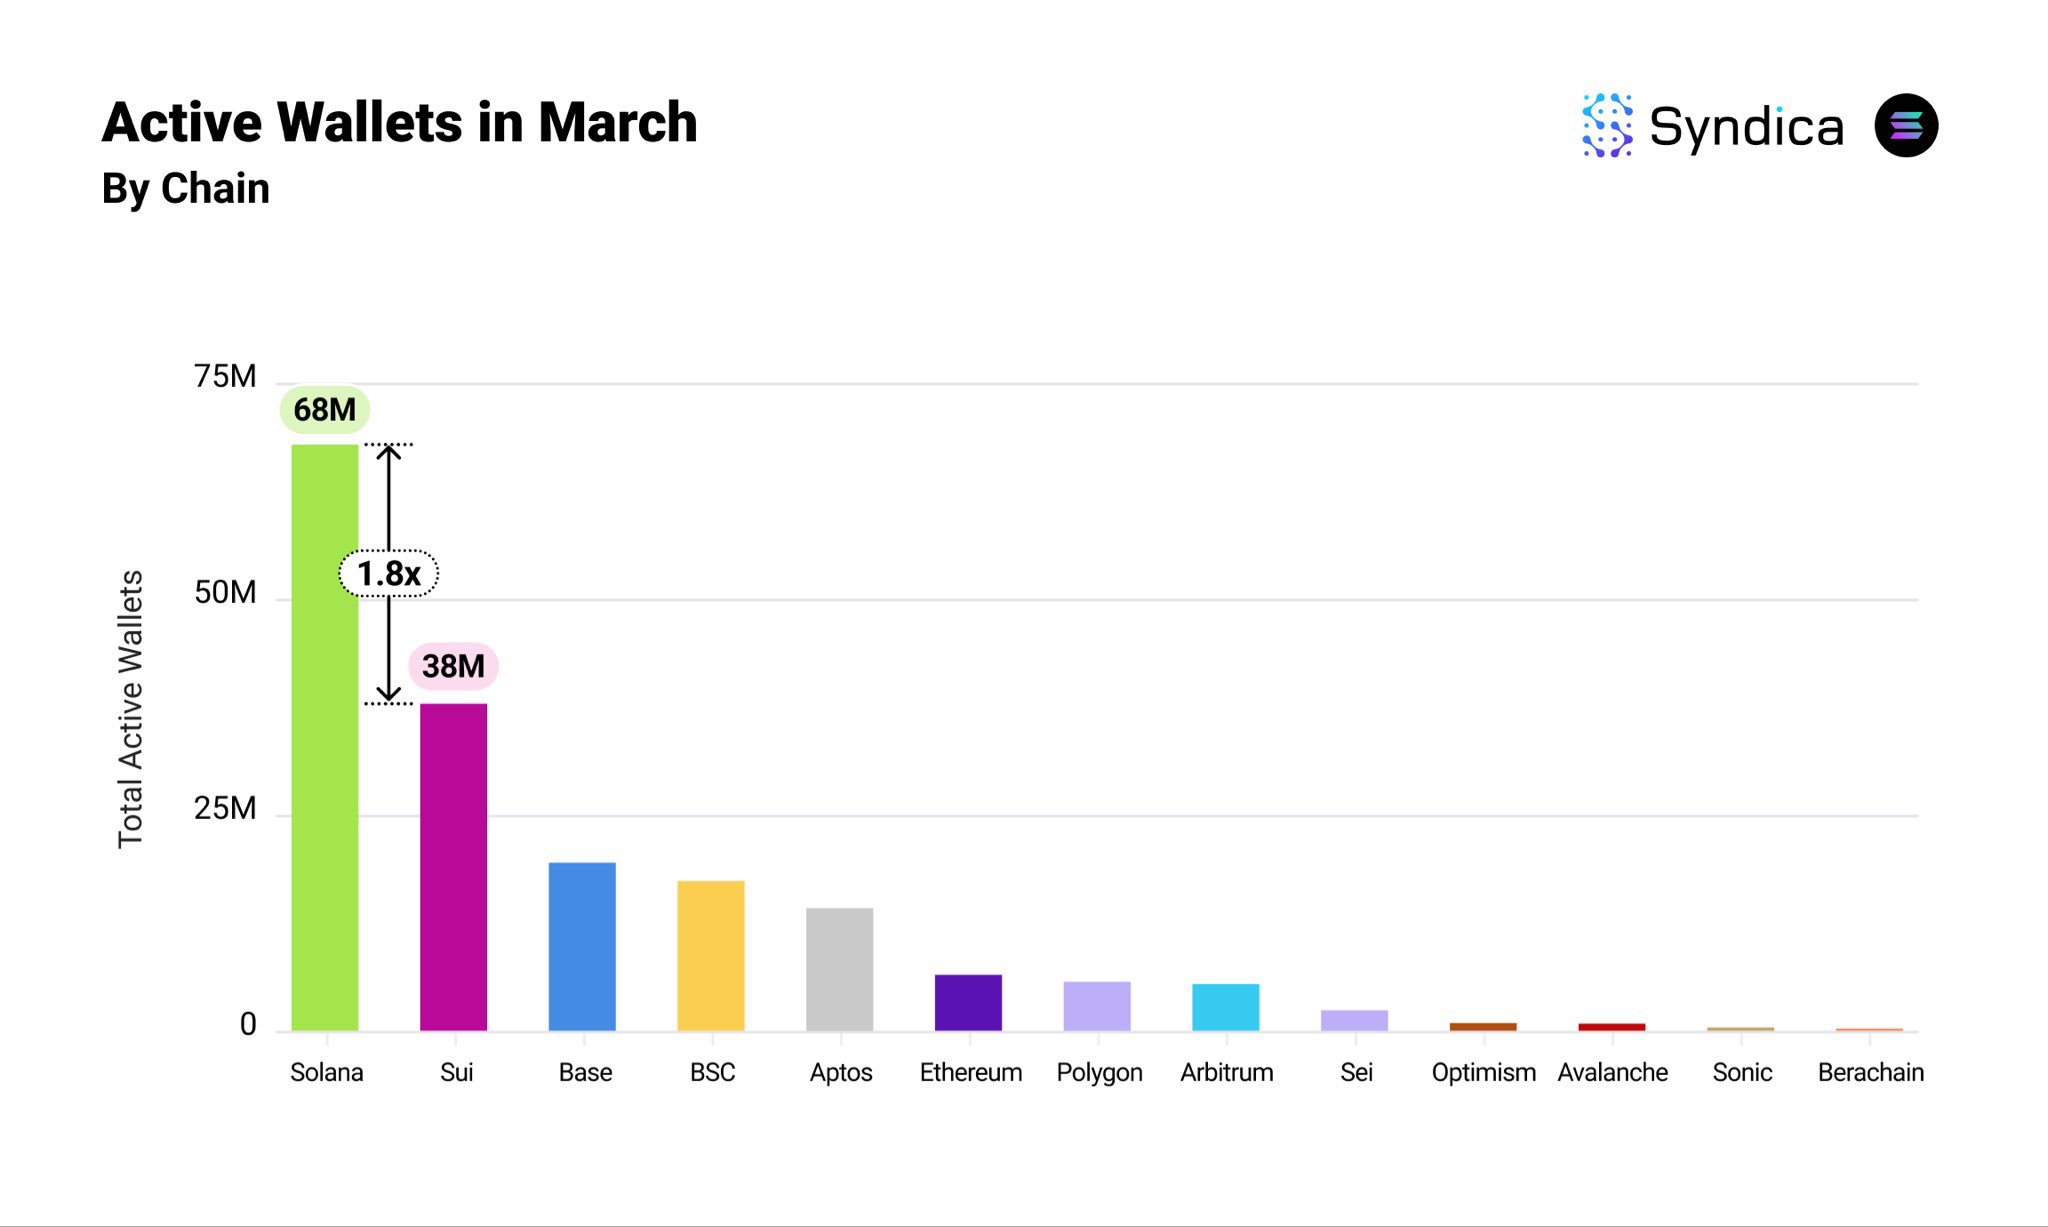
Additionally, the monthly active wallets on Solana hit a new all-time high of 68 million in March, compared to the nearest competitor, SUI. The difference in the monthly active wallets between SUI and Solana is 30 million. The monthly active wallets on SUI were 38 million in March, reflecting a 1.8x difference between the two chains.
Notably, this reflects a short-term growth in network activity, ignoring the market volatility.
Analyst Warns of A Drop to $60
Despite signs of a potential bullish recovery and improving network fundamentals, crypto analyst Ali Martinez warns of a possible correction in Solana.
In a recent X post, Ali highlighted the potential for a breakdown of an ascending broadening pattern visible on the 3-day chart. If this correction unfolds, he sets a bearish target for Solana at $65.
For all we know, #Solana $SOL might be retesting the breakout zone from a right-angled ascending broadening pattern, with the $65 target still in play. pic.twitter.com/vujFJQWurz
— Ali (@ali_charts) April 16, 2025
DisClamier: This content is informational and should not be considered financial advice. The views expressed in this article may include the author's personal opinions and do not reflect The Crypto Basic opinion. Readers are encouraged to do thorough research before making any investment decisions. The Crypto Basic is not responsible for any financial losses.