

Adam Back confirms the Bitcoin 200WMA has surged, marking a shift and signaling early-stage bull cycle momentum.
Bitcoin’s price climbed to a local peak of $106,000 on Sunday, May 18, marking its highest level since early February 2025. Within the past seven days, the asset moved between $101,000 and $106,000, reflecting a highly volatile trading range.
As of May 19, Bitcoin trades at $102,761, showing a 0.89% 24-hour decline and a 1.81% drop over the past week. Despite these fluctuations, several long-term indicators have begun shifting upward, signaling a change in market dynamics.
200W MA has now exceeded $47,000
Blockstream CEO Adam Back confirmed that Bitcoin’s 200-week moving average (200WMA) has now exceeded $47,000. This level marks a critical milestone in Bitcoin’s historical trend analysis. Bitcoin surged from the $46,000 level and crossed $47,000 in under 30 days, marking a rapid $1,000 gain.
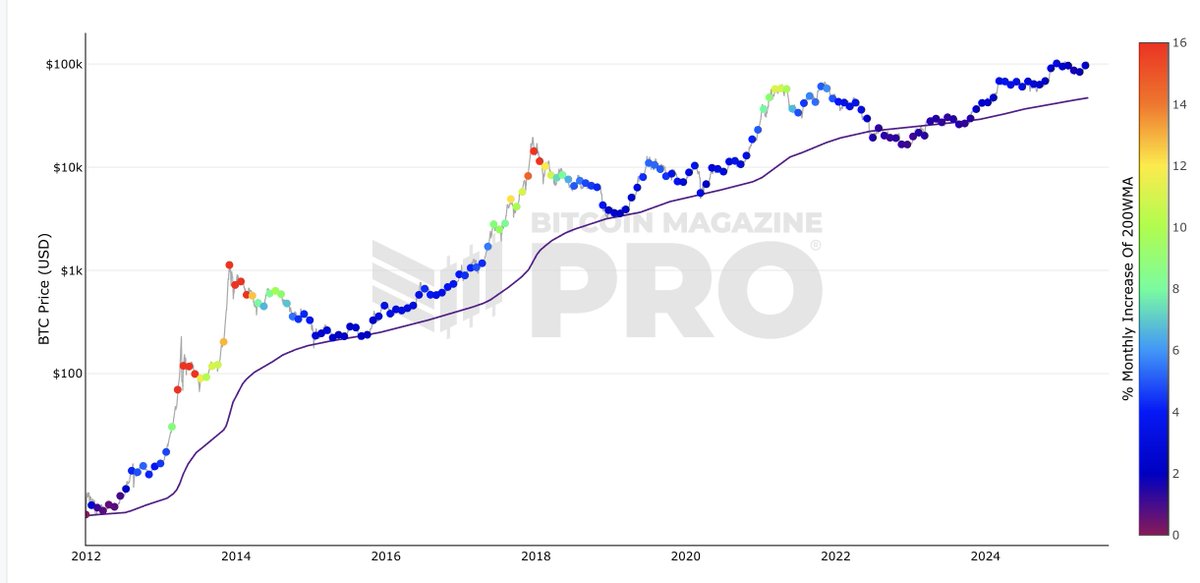

The 200WMA serves as a key long-term indicator by smoothing out short-term volatility and revealing underlying cycle behavior. Notably, Back previously confirmed that the 200WMA essentially serves as Bitcoin’s floor price, as the asset does not trade below this level.
The indicator stood at $40,000 as of October 2024 but has continued to increase since then. According to historical chart data from 2012 to 2025, the moving average typically steepens during bull markets and flattens during bearish phases.
Notably, in earlier cycles such as 2012–2014 and 2017–2018, the 200WMA showed accelerated monthly growth, reaching over 10–15%. During these times, Bitcoin entered euphoric rallies.
In contrast, color-coded indicators now suggest Bitcoin is in an early expansion phase, with the 200WMA rising at a slower pace of 2–6% per month. This pattern, based on long-term chart visuals, shows the blue-to-light purple color range currently dominating price action in 2025, indicating gradual but steady growth.
The moving average’s rise past $47,000 suggests Bitcoin may have entered the early to mid-stages of a new bull cycle. Historically, similar phases showed steady growth before more aggressive price acceleration occurred. Additionally, Bitcoin’s sustained move above a rising 200-week moving average also signals a strong long-term base formation.
Structural Momentum Ahead of Market Acceleration
While price volatility remains high, momentum indicators are turning positive. According to on-chain analyst Willy Woo, Bitcoin’s compound annual growth rate (CAGR) has declined significantly since its peak years.
In 2017, the asset saw triple-digit growth rates. However, by 2020, with the entry of corporations and sovereign entities, the CAGR dropped to the 30–40% range. Woo noted that this trend has continued downward as Bitcoin absorbs more capital and shifts toward being a macro asset.
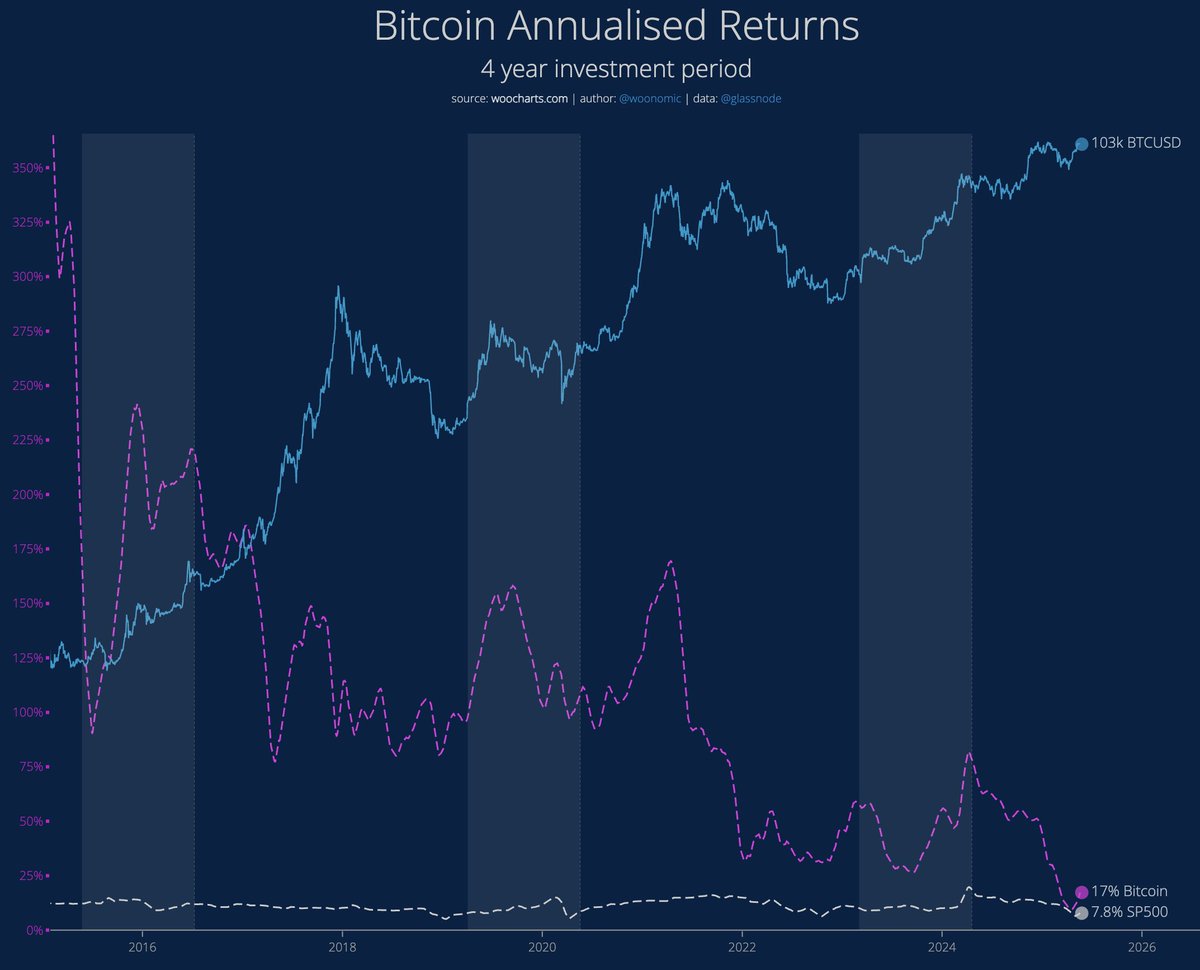
Meanwhile, Woo stated that the long-term CAGR may eventually stabilize near 8%, citing macroeconomic trends like monetary expansion and global GDP growth. Though this transition could take over a decade, the asset’s structural positioning remains distinct. This aligns with the gradual uptick in the 200WMA and current low-growth color zones.
Bitcoin Higher High to Form
On May 18, Bitcoin also recorded its highest daily candle close on record, ending above $105,000.
Analyst Rekt Capital opined that this development may indicate a fresh higher high forming on longer timeframes. Though the short-term price dipped back to $102K, the structural indicators remain the focus for many analysts tracking Bitcoin’s multi-year behavior.
#BTC Daily Close above ~$105000 and Bitcoin will develop a brand new Higher High$BTC #Crypto #Bitcoin
— Rekt Capital (@rektcapital) May 18, 2025
DisClamier: This content is informational and should not be considered financial advice. The views expressed in this article may include the author's personal opinions and do not reflect The Crypto Basic opinion. Readers are encouraged to do thorough research before making any investment decisions. The Crypto Basic is not responsible for any financial losses.