

Trader Tardigrade identifies a recurring rounded bottom pattern on the Dogecoin 6-month chart, highlighting an accumulation phase awaiting a breakout.
Dogecoin’s price movements over the past week have revealed heightened volatility, with frequent swings between $0.210 and $0.235. As of today, Dogecoin (DOGE) is trading at $0.2296.
While short-term price action remains active, technical analysts and on-chain metrics have shifted attention to larger macro trends forming on the charts.
This Pattern Signals Third Accumulation Phase
According to Trader Tardigrade, a technical analyst on X, Dogecoin’s 6-month chart shows a consistent pattern repeating over the years. The analyst has identified a recurring “rounded bottom” or cup formation, which previously appeared ahead of major rallies.
These cup-shaped patterns, marked by gradual accumulation phases, are visible three times on the chart, each followed by significant breakouts.

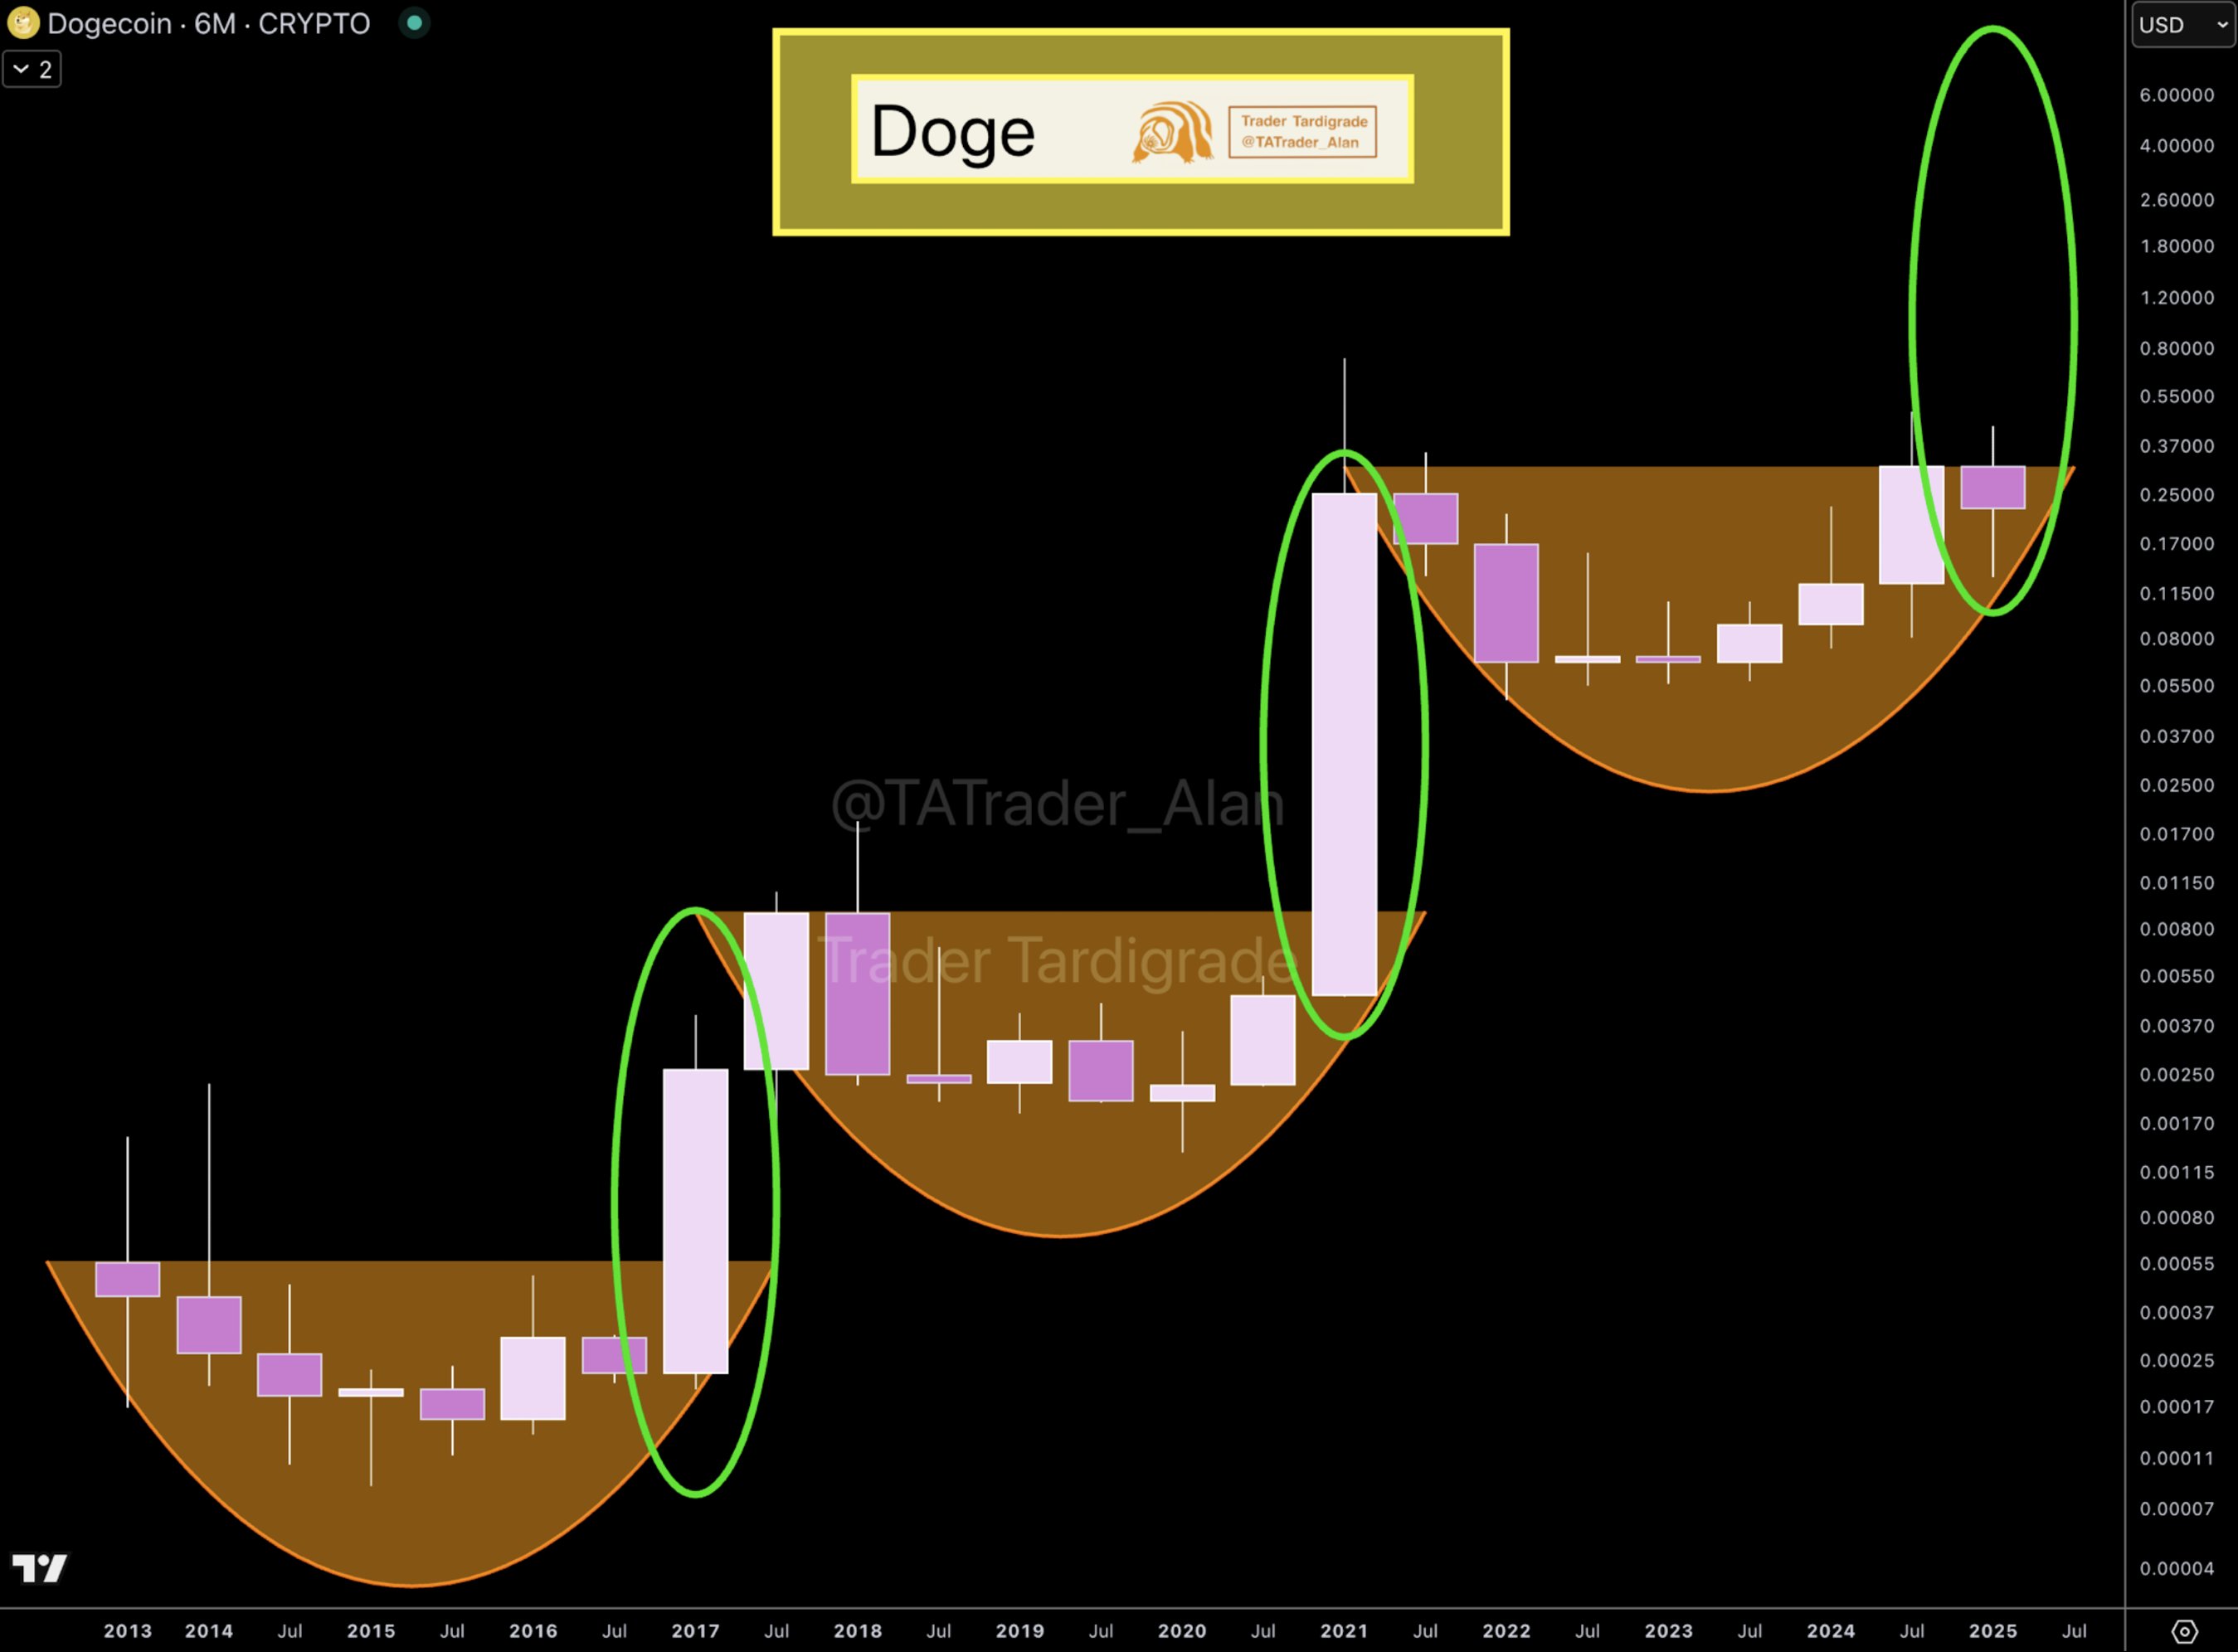
The first instance occurred between 2014 and 2017. During this period, Dogecoin traded with low volatility before breaking out in mid-2017, rising from approximately $0.00011 to nearly $0.003. A similar pattern formed from 2018 to 2020. That consolidation phase ended with a breakout in late 2020, which drove prices to a peak above $0.6 in 2021.
The chart now shows a third rounded structure forming between 2022 and 2025. If the historical trend persists, Tardigrade’s chart points to a potential breakout that could propel DOGE above the $6 mark. Dogecoin would surge approximately 2,513% from $0.2296 to $6.00.
Surge in Address Activity Reinforces Technical Setup
Meanwhile, on-chain data from recent weeks supports the ongoing accumulation narrative. Specifically, Dogecoin New Addresses rose by 102.40% in the last seven days, while Active Addresses grew by 111.32%.

Zero Balance Addresses also climbed by 155.50%. This uptick coincided with Dogecoin’s recent price gains, suggesting rising user engagement alongside technical accumulation.
Furthermore, the Ownership Concentration chart reveals changes in wallet segments over the last 30 days. Whale holdings increased slightly by 0.34%, while investor wallets decreased by 2.59%. Meanwhile, retail participation rose by 1.44%, indicating a minor shift in token distribution.

Key Trendline and Reversal Structure Under Watch
In parallel, technical analysis by Bitcoinsensus highlights an Inverse Head and Shoulders pattern forming on Dogecoin’s daily chart. The formation began in March 2025 at nearly $0.15, developed its head in April during a deeper price dip, and completed the right shoulder later in the month after rebounding above $0.165. The pattern’s neckline, which slopes downward, acted as a key resistance point.
According to Bitcoinsensus, DOGE broke above the neckline, potentially marking the start of a new bullish phase. However, the asset remains capped under a broader descending trendline active since late 2024.
This long-term resistance triggered rejections at $0.46 in December 2024 and again at $0.42 in January 2025, followed by a drop to $0.135. Per the analysis, Dogecoin is retesting this trendline. A breakout and confirmation above this level may direct price action toward the $0.42–$0.43 supply zone.
DisClamier: This content is informational and should not be considered financial advice. The views expressed in this article may include the author's personal opinions and do not reflect The Crypto Basic opinion. Readers are encouraged to do thorough research before making any investment decisions. The Crypto Basic is not responsible for any financial losses.