

Solana holds firm above $165, with bullish technicals pointing to a potential breakout at $215. Can bulls overcome resistance at $184 and continue the rally?
After an 18% surge this month, Solana is taking a breather, maintaining a sideways trend above $165. While this short-term consolidation raises the risk of a double top reversal, the prevailing uptrend targets a breakout above $180.
Solana Price Analysis
On the daily chart, Solana’s sideways movement suggests a potential double top formation near the 61.80% Fibonacci retracement level at $184.52. Facing resistance from the $180 supply zone, Solana continues its sideways shift.

The 50% Fibonacci level at $165 acts as the lower boundary, while a close positioning of the 200-day EMA at $163 provides additional support. Moreover, a positive crossover between the 50-day and 100-day EMAs signals a possible trend reversal.
However, the MACD and signal lines have yet to achieve a bullish crossover, despite moving closely together. As the consolidation continues, the risk of a bearish reversal from a falling wedge breakout increases.

According to Fibonacci levels, a potential upside breakout could reach $215, marked by the 78.60% retracement, with an extended price target near $261.
On the downside, failure to hold bullish support above $165 could test the 50-day EMA at $158, followed by the 38.20% Fibonacci level at $148. Consequently, a breakdown may threaten the $150 psychological level.
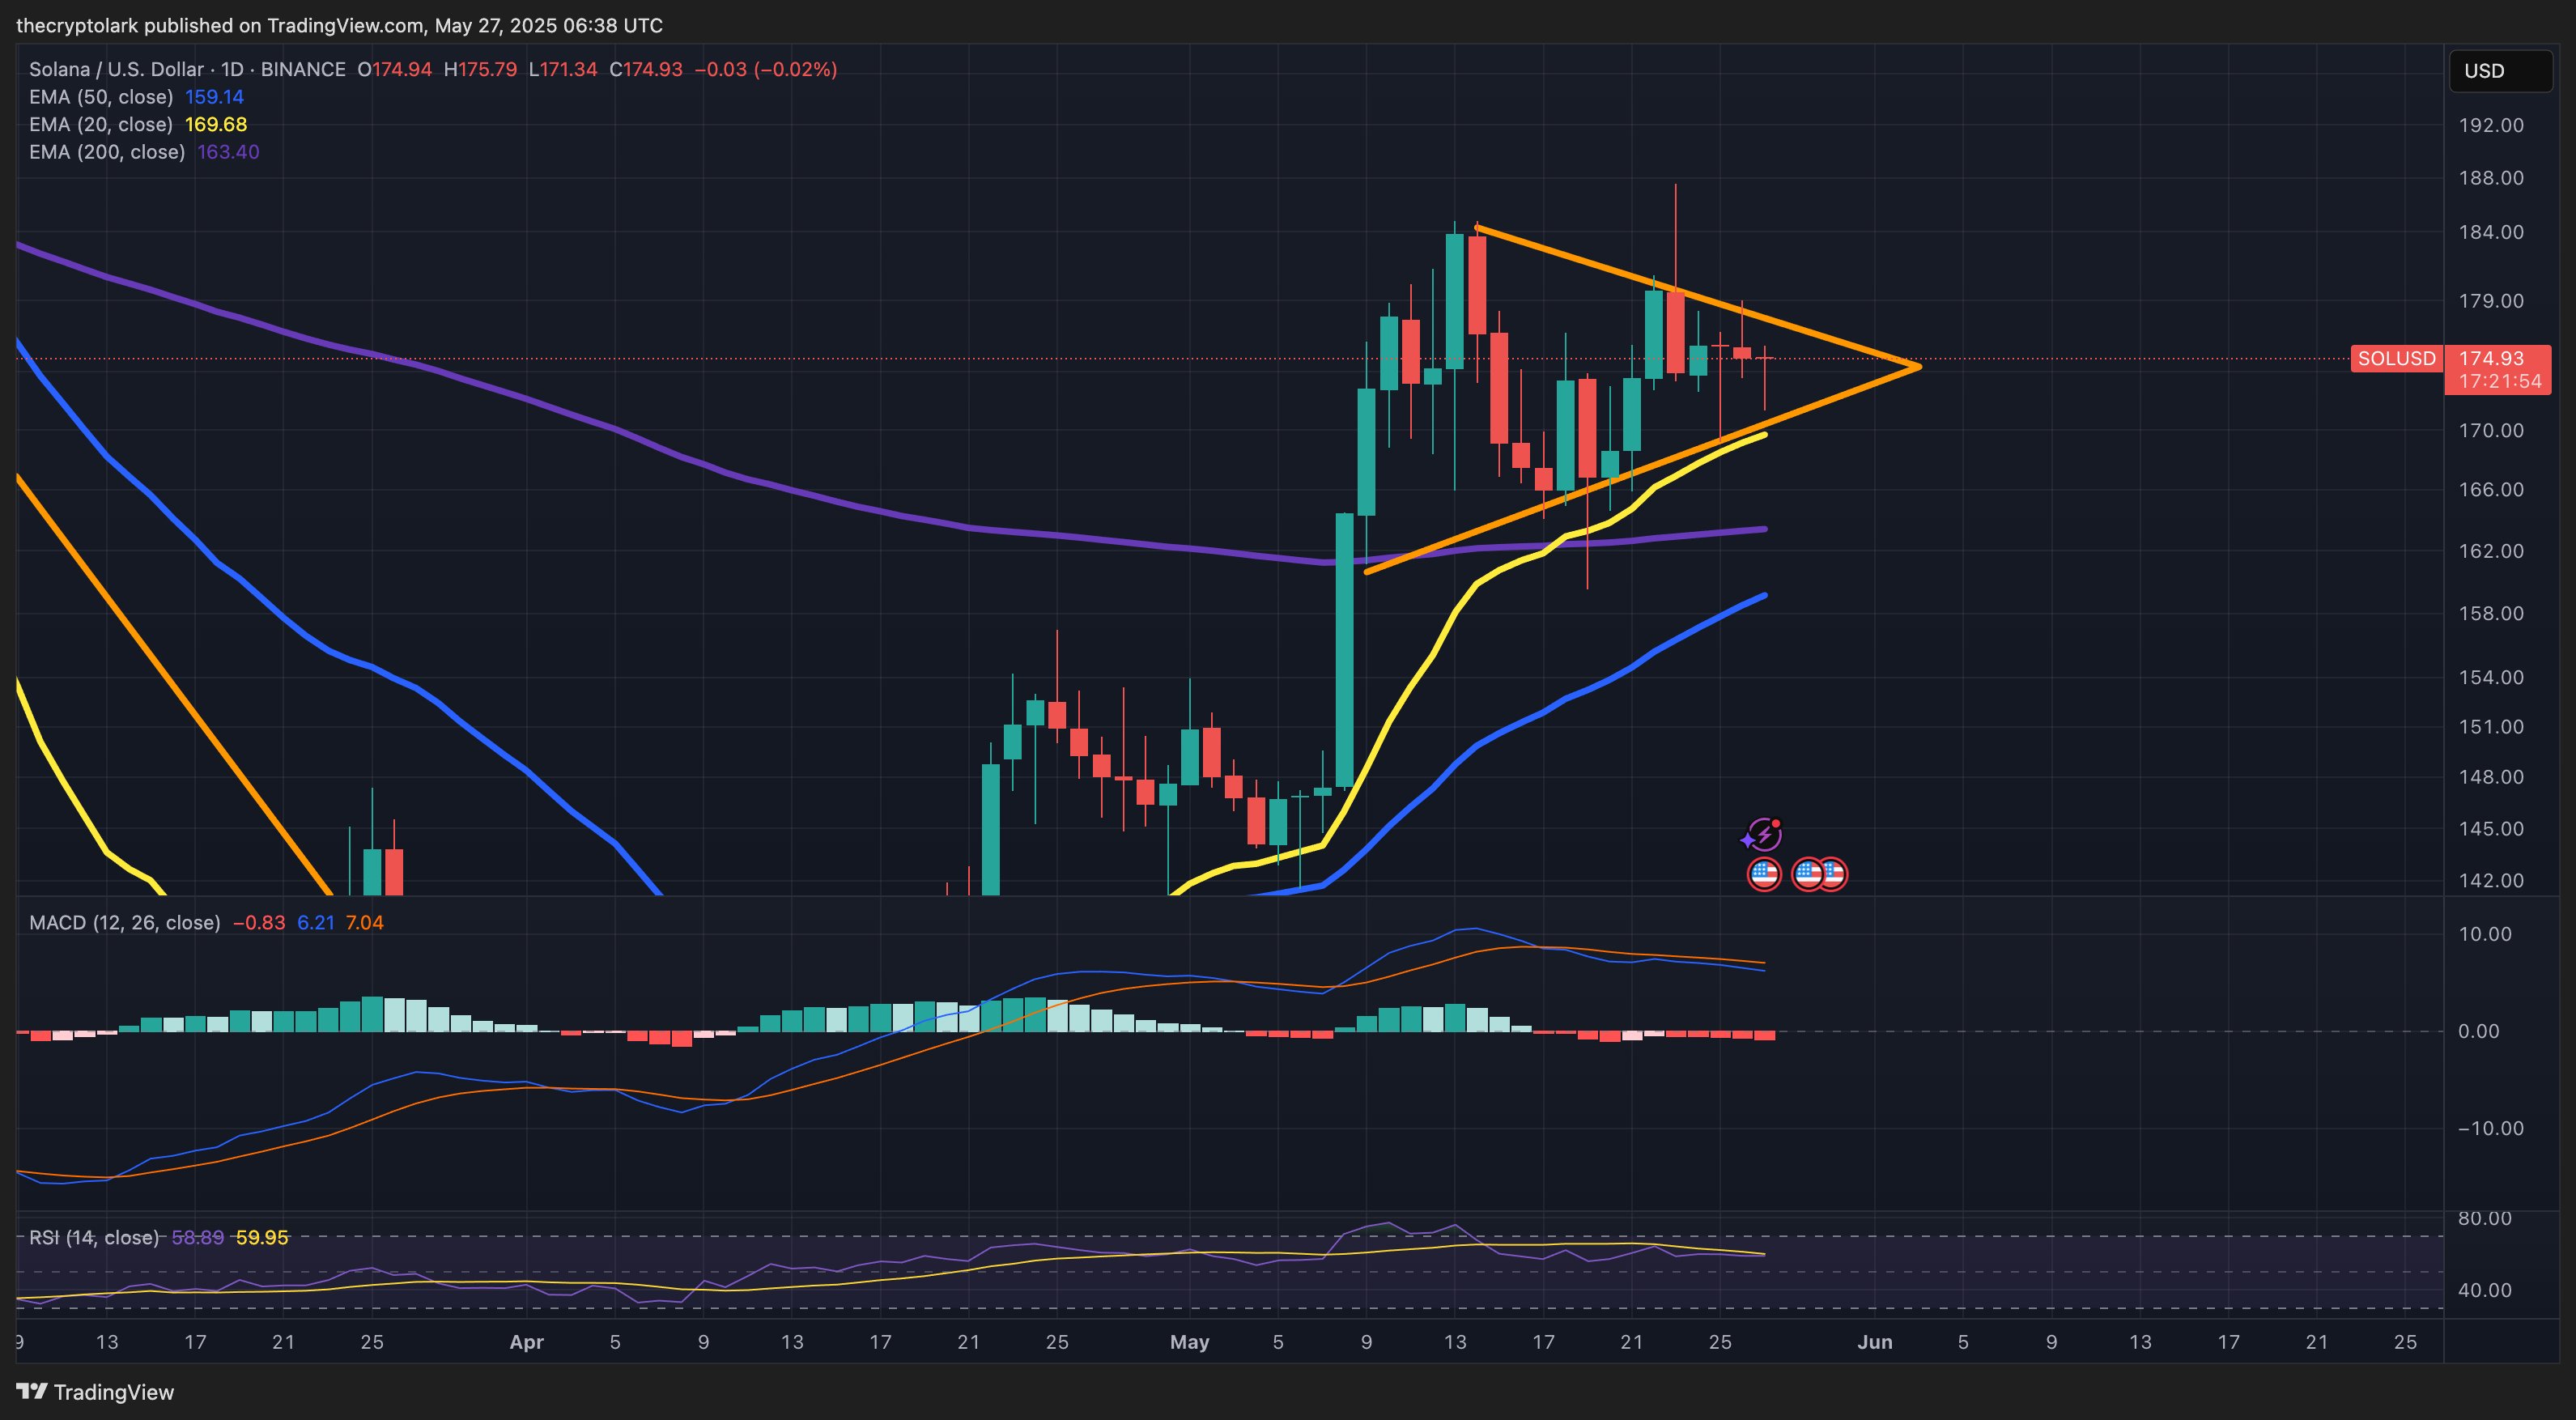
Analyst Targets $200 With Bullish Pennant.
As Solana consolidates, crypto analyst Lark Davis identifies a bullish pennant forming on the daily chart. Following the bull run in early May, the symmetrical triangle pattern suggests a potential breakout rally to $200 if bulls maintain control.
The analyst noted critical support levels, including the 20-day EMA at $169 and the 200-day EMA at $163.
Derivatives Data Signals Bearish Warning
Despite the optimistic price outlook, derivatives data show a surge in bearish activity. Open interest has declined by 1.09% to $7.25 billion, indicating a slowdown in trader activity.
Furthermore, the recent flip in the OI-weighted funding rate to -0.0035% reflects bearish sentiment. Overall, 24-hour-long liquidations of $4.92 million significantly outnumber short liquidations of $1.36 million. This larger shakeout of bullish players suggests a bearish bias in the derivatives market.

DisClamier: This content is informational and should not be considered financial advice. The views expressed in this article may include the author's personal opinions and do not reflect The Crypto Basic opinion. Readers are encouraged to do thorough research before making any investment decisions. The Crypto Basic is not responsible for any financial losses.