

The bullish Bitcoin momentum saw it defy a major bearish pattern on the daily chart, raising confidence of a continued upward trajectory.
Bitcoin has again demonstrated strength over the past few days. Notably, a wave of corrective momentum kicked in on Tuesday, sparking a three-day downtrend, during which the crypto leader corrected by 4%.
Much of the Thursday retracement emerged following market skepticism from an unrelated war of words between US President Donald Trump and Elon Musk. The tension saw Bitcoin briefly touch $100,000 before bulls stepped in again and pushed prices back up.
Price Rebound Nullifies Bullish Structure
However, Frank Cappelleri, a top analyst and CEO of CappThesis, identified a bullish development worth noting on the BTC/USDT 1D chart. Specifically, Bitcoin’s reversal has just defied a major bearish structure with its 4.5% bounce from Thursday’s lows of $100,430.
An elaborate accompanying chart shows that Bitcoin broke down from the base of a head-and-shoulders pattern with its June 5 dump. The structure has been shaping up since last month, with May 12’s high of $105,720 forming the left shoulder.

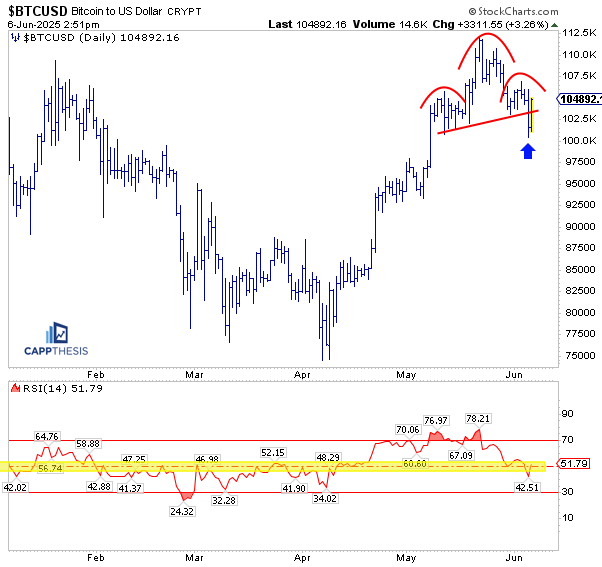
Furthermore, the head formed when Bitcoin hit its all-time high of $111,200 on May 22, with the right shoulder of $106,843 on June 3 completing the bearish pattern. Following the formation of this structure, analysts expect BTC to begin a downward trend once it breaks below the neckline.
Interestingly, the premier asset broke down from the structure’s base two days ago, confirming the beginning of the downtrend.
Nonetheless, Bitcoin’s rebound has pushed prices above the base again, with Cappelleri suggesting that it might have defied the bearish trend. The top analyst noted that the trend indicates a key characteristic of an uptrend, insisting that BTC has not yet exhausted its bullish momentum.
Bitcoin Fakeout Suggests a Breakout Is Imminent
Moreover, a parallel tweet identifies a new perspective on Bitcoin’s recent price action. Merlijn The Trader shared today that the asset is on the cusp of breaking out after temporarily shaking off weak hands with a fakeout.
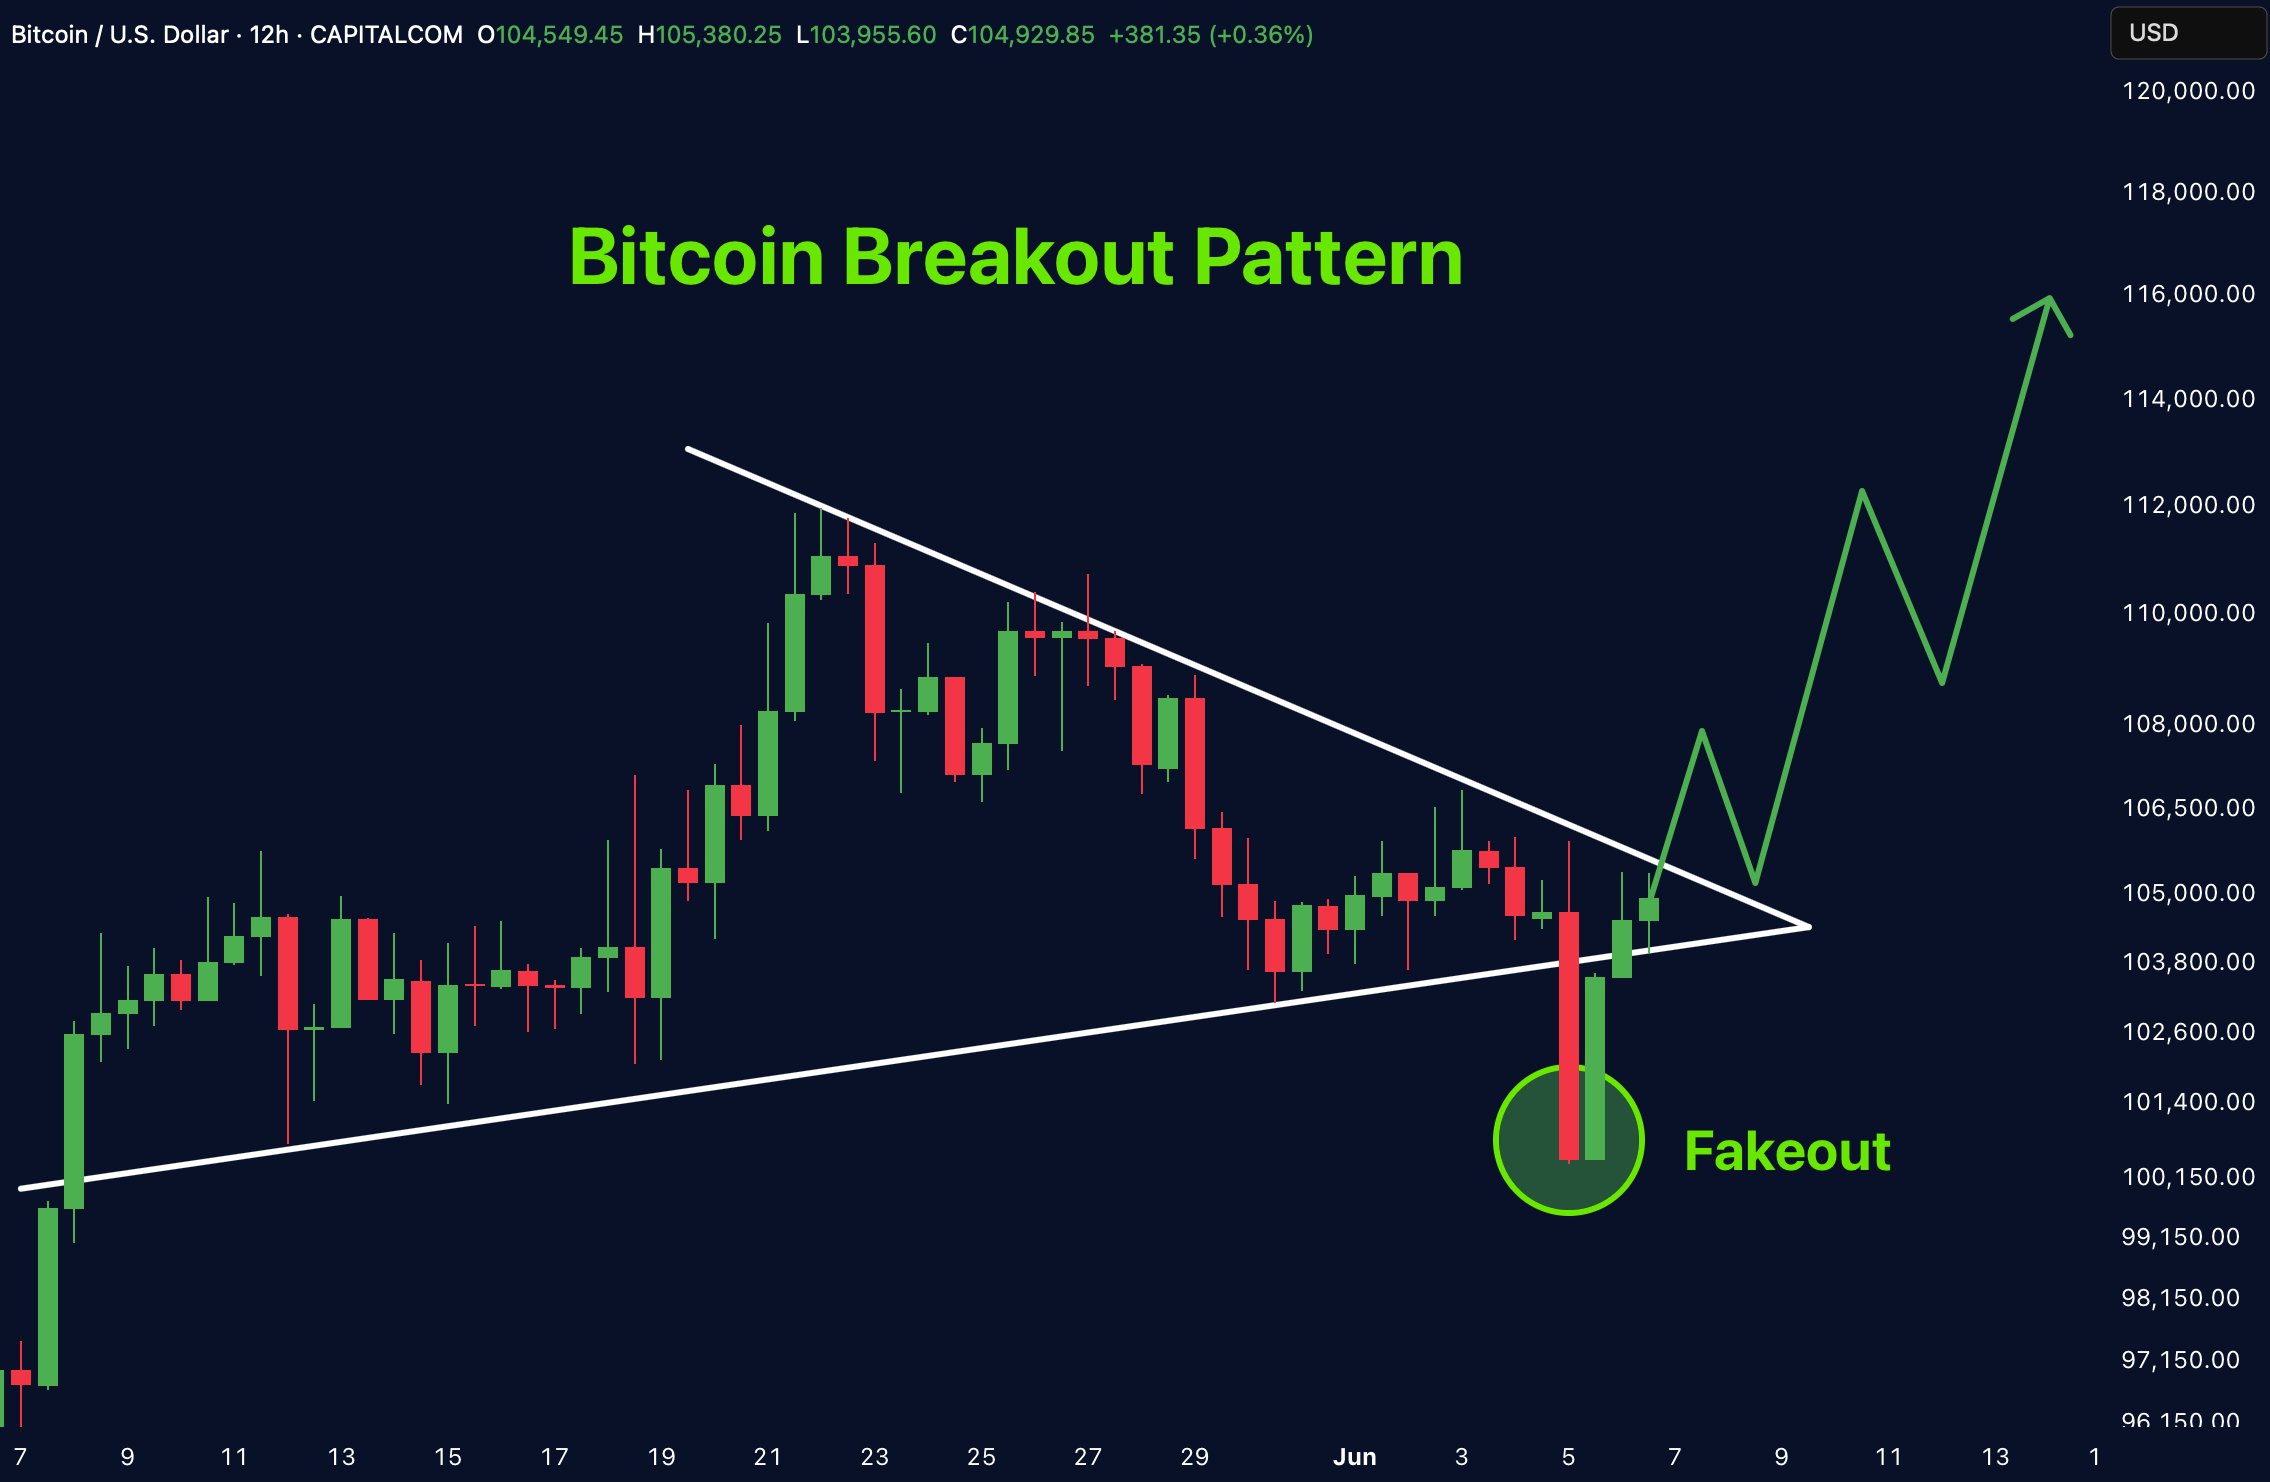
For context, Bitcoin has been trending within a bullish pennant formation since May 9 on the 12-hour timeframe. However, with prices getting tighter within the wedge, Thursday’s 3% correction saw a fake drop below the triangle, temporarily defying the bullish structure.
Nonetheless, Bitcoin has reclaimed the triangle and now eyes an upward break to unprecedented prices. Specifically, his chart shows a possible 10.2% rally to $116,000, a new all-time high.
DisClamier: This content is informational and should not be considered financial advice. The views expressed in this article may include the author's personal opinions and do not reflect The Crypto Basic opinion. Readers are encouraged to do thorough research before making any investment decisions. The Crypto Basic is not responsible for any financial losses.