

XRP may be warming up for a strong price rally, with market analyst EGRAG pointing to a mix of technical tools that could drive it to two digits.
In his latest analysis, EGRAG tied together three charts using the Kangaroo Technique, the Gaussian Channel, the 21-week Exponential Moving Average (EMA), and Elliott Wave Theory. His analysis presented how these indicators all point toward an ongoing consolidation that may soon flip into an uptrend.
The Gaussian Channel, Kangaroo Technique, and 21 EMA
EGRAG’s first chart shows XRP holding above the top line of the Gaussian Channel, currently at $1.75. He sees this price level as critical. If XRP stays above it on a weekly close, it keeps the bullish trend alive. However, a close below that line could signal the start of a deeper pullback.
On the same chart, EGRAG placed kangaroo icons to mark other important zones: one near $0.06 and another around $3.40. Notably, the kangaroo icon at the $0.06 zone in 2017 aligned with a launchpad to the $3.8 all-time high later that year.

Notably, the appearance of another kangaroo icon at the recent $3.4 high suggests this price could also serve as a launchpad. EGRAG also highlighted the 21 EMA, which appears just below the current price and confirms a bullish tone as long as XRP doesn’t fall under it.

Further, he mentioned a pattern from 2017 that shows a buildup before the breakout to $3.8 in January 2018. According to him, XRP could repeat this pattern if a breakout occurs in July. However, if XRP fails to rally in July, he believes the market may move sideways for up to 110 days.
XRP Elliott Waves Eye $10 Target
Meanwhile, in the second chart, EGRAG pointed to $2.33 as the next major resistance just above the EMA. Specifically, if XRP crosses that level, the bullish momentum could strengthen. He also identified $2.65 as a breakout trigger, calling it the “go-go signal.” A weekly close above that line would confirm a firm move upward.
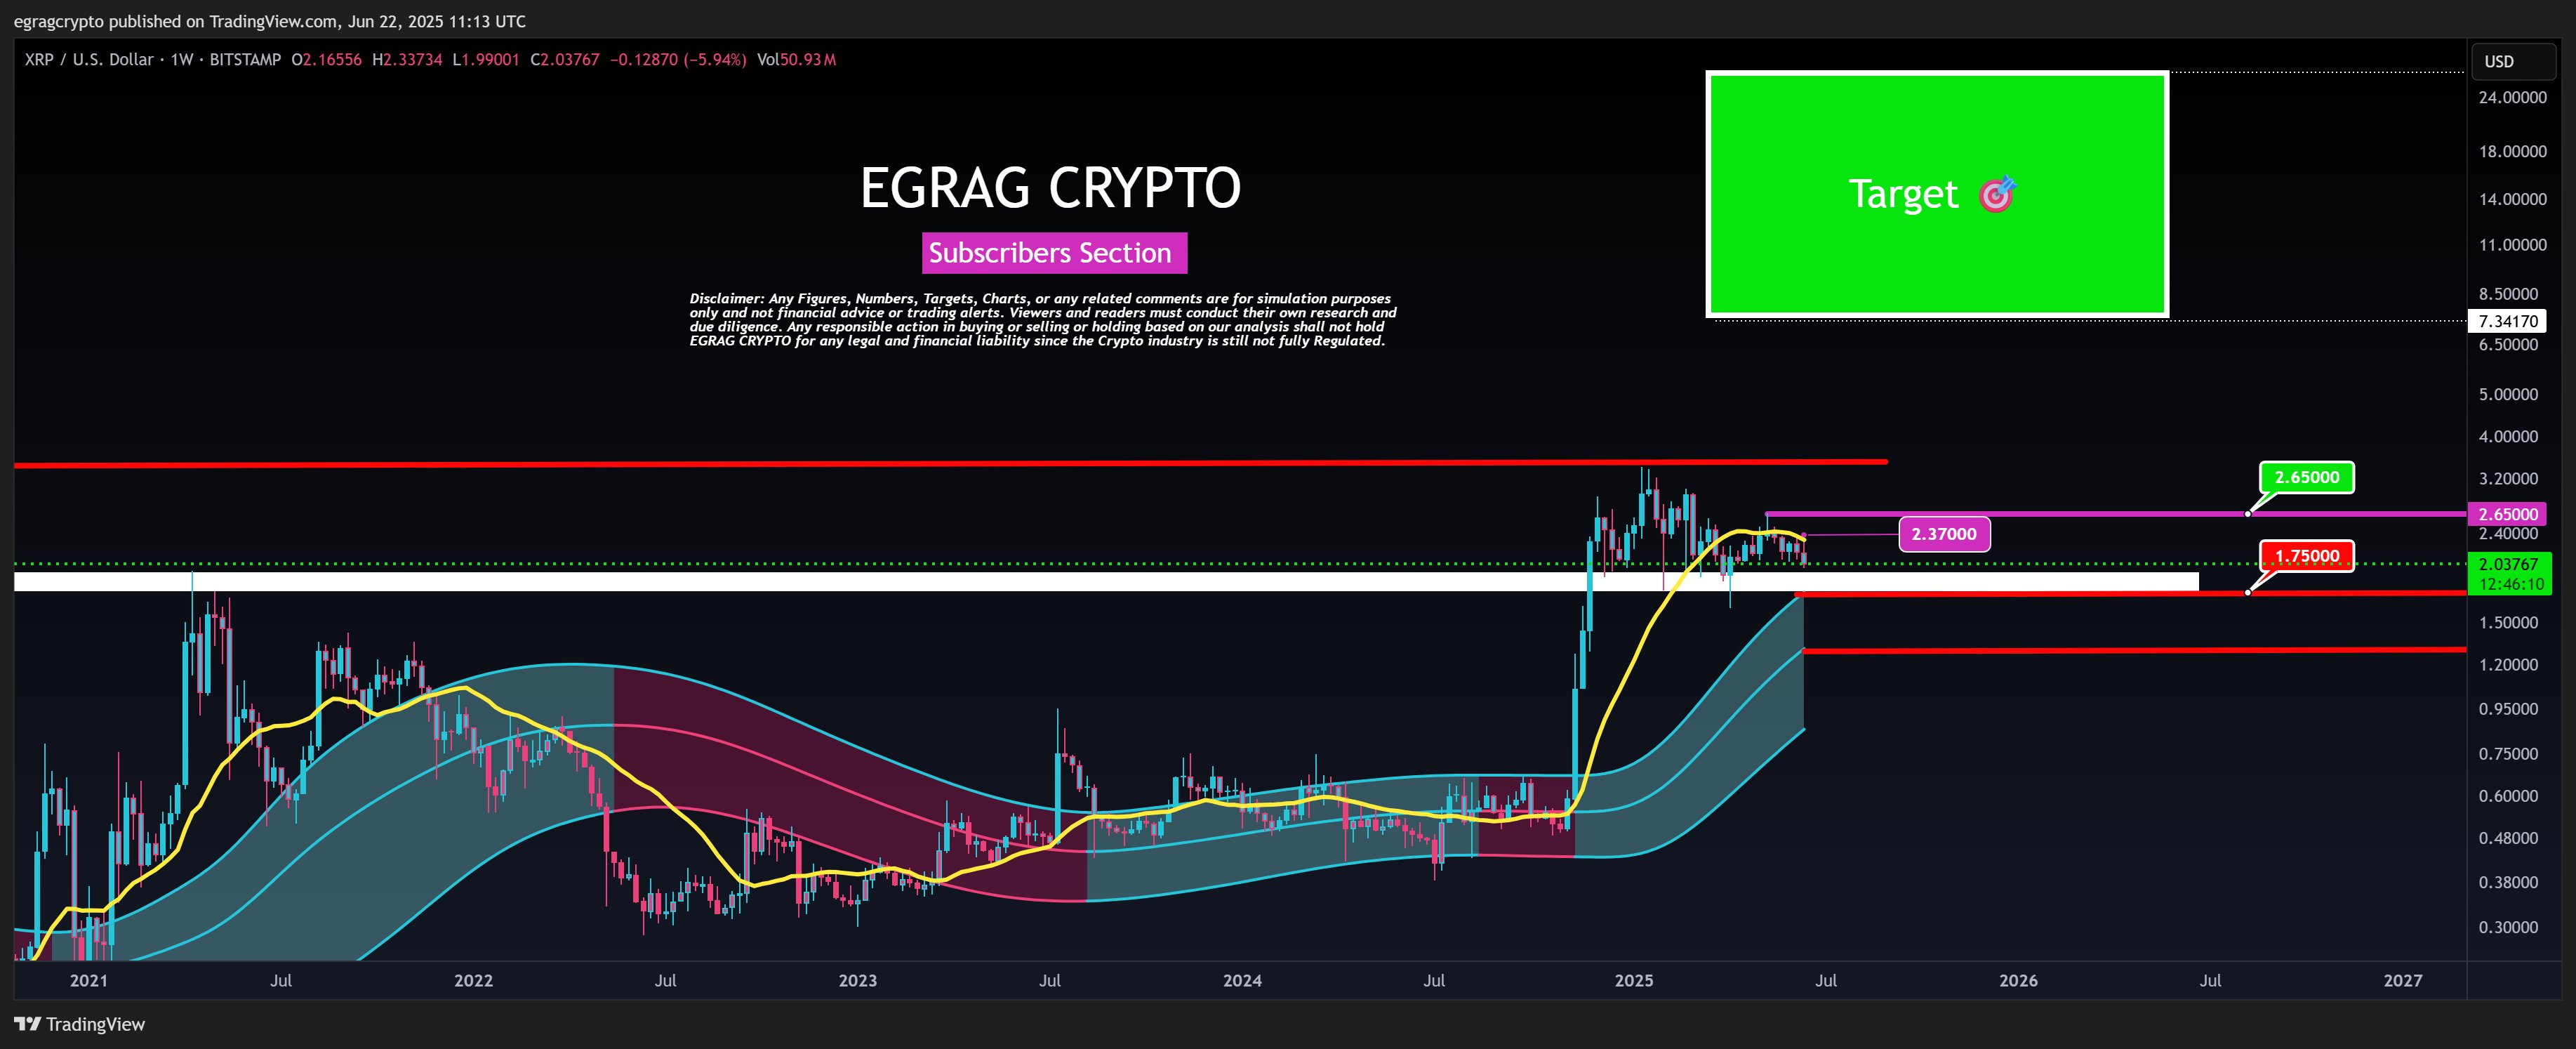
Despite the recent drop amid the market-wide collapse, XRP still holds the $2 price support, which keeps it well above the key $1.75 level. EGRAG sees this recent dip as part of normal volatility but warns that slipping below $1.75 could damage the setup.
Notably, the third chart uses Elliott Wave Theory to highlight XRP’s current position. EGRAG believes XRP sits in Wave 5 of a larger cycle, which typically marks the final push upward. He calculated a potential 477% gain based on Fibonacci extensions, which places the next big target between $9 and $10.
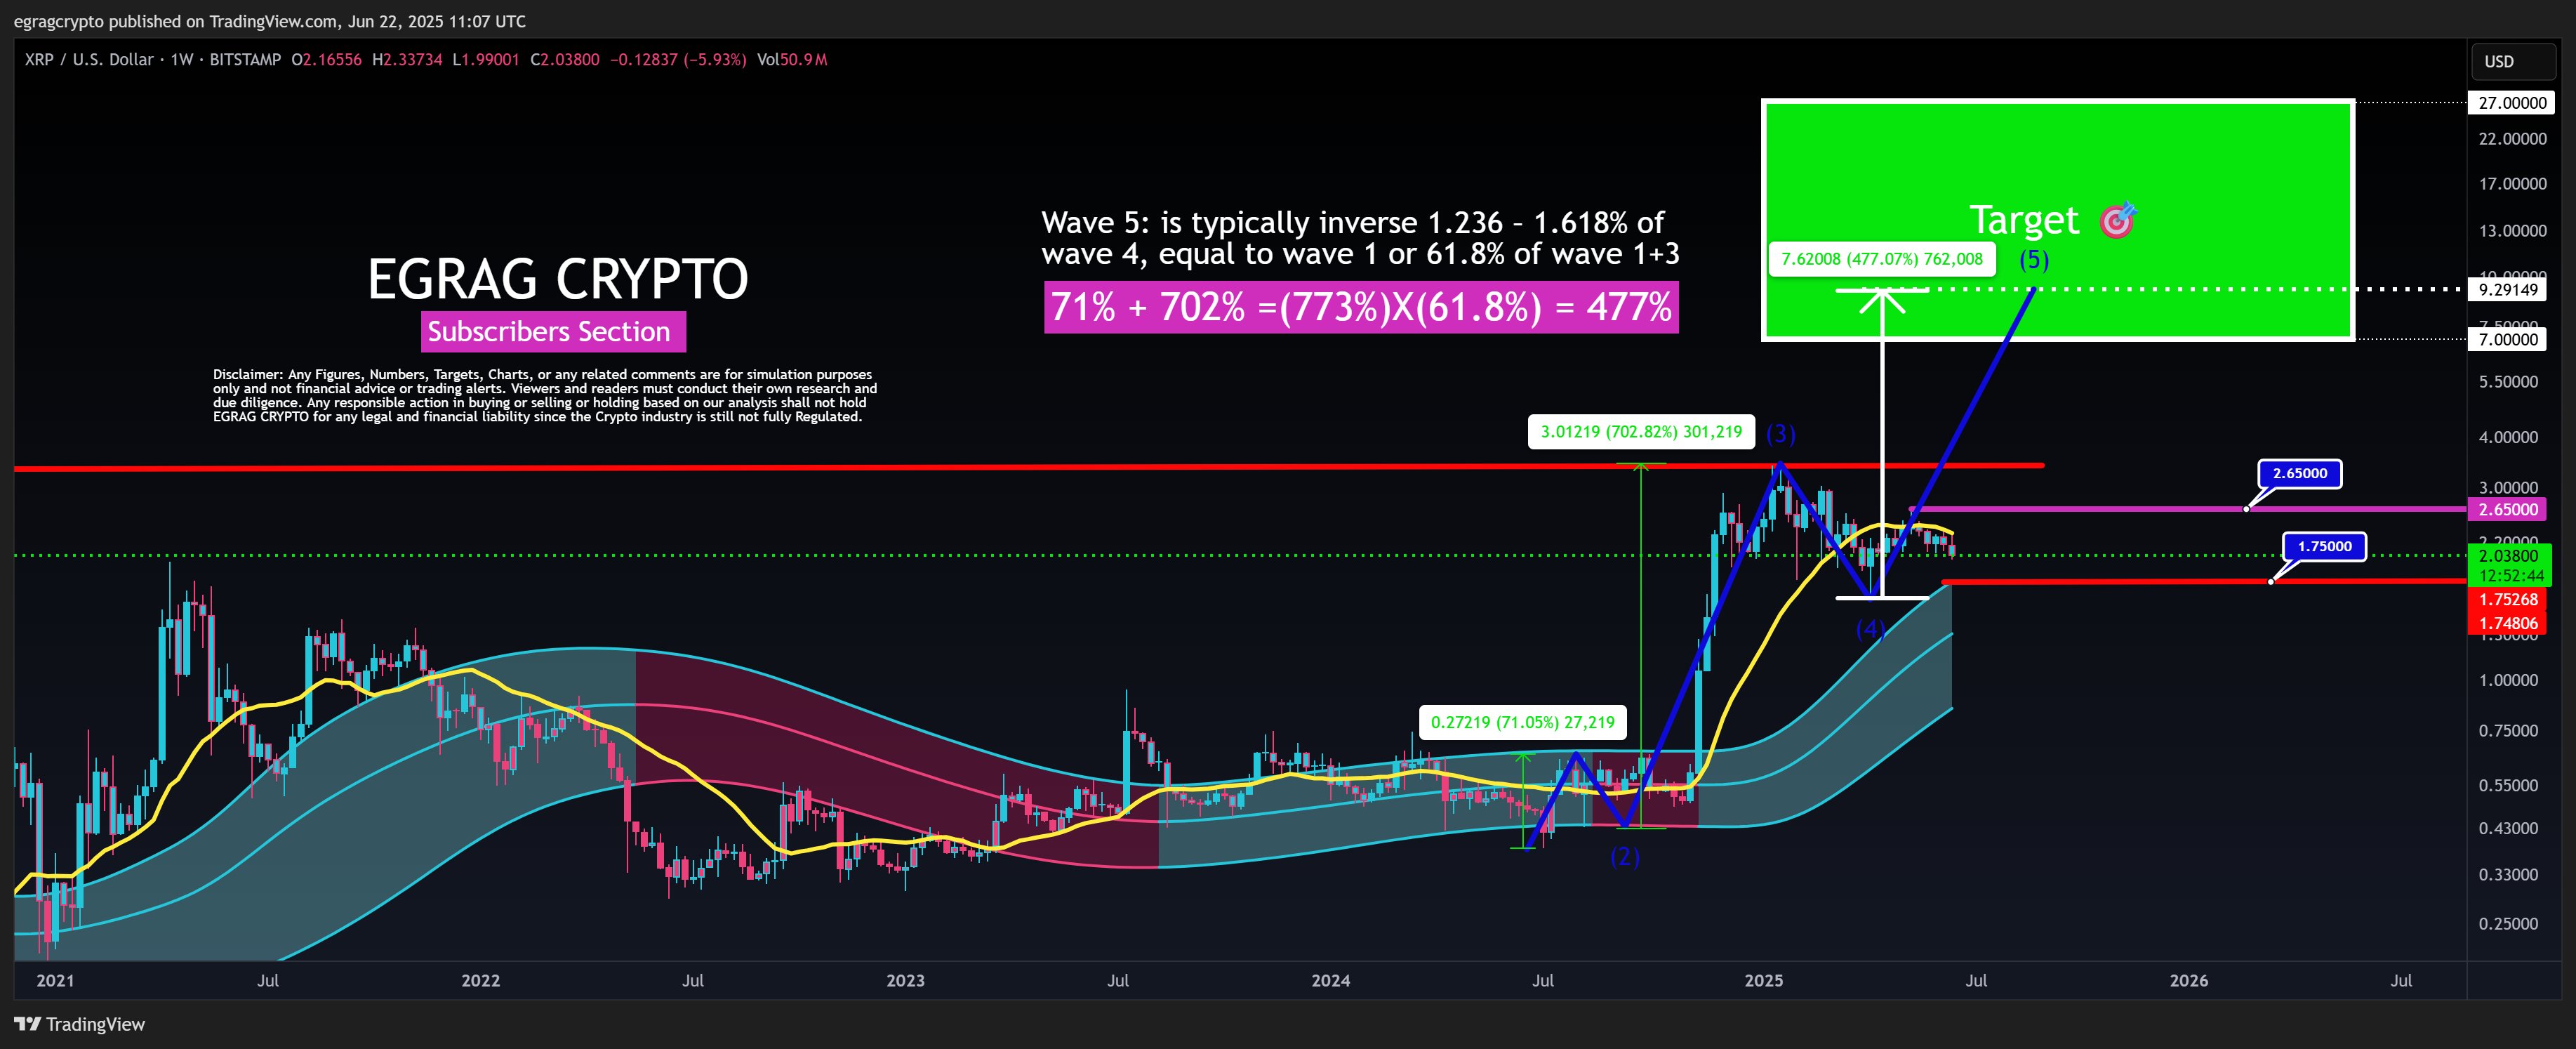
He based this on the combined strength of Waves 1 and 3, applying the 61.8% ratio to estimate Wave 5. While EGRAG names $10 as a near-term peak, he also hints at a possible stretch to $27 if momentum continues.
Still, there are some risks. XRP must hold the $1.75 level to maintain its bullish structure. If the token fails to break higher before the end of July, the market may abandon the current pattern and slide into another long period of sideways movement.
However, in the short run, traders should watch for XRP to reach $2.33 and then $2.65. Those two levels could confirm the beginning of a strong rally. If the support holds and XRP breaks past resistance, the road to $10 may begin.
DisClamier: This content is informational and should not be considered financial advice. The views expressed in this article may include the author's personal opinions and do not reflect The Crypto Basic opinion. Readers are encouraged to do thorough research before making any investment decisions. The Crypto Basic is not responsible for any financial losses.