

Cardano could still reach double-digit figures if it replicates just half of its price performance from this point in the previous bull cycle.
Like most other altcoins, Cardano is deep in the red. Specifically, the blue-chip asset is down 3.78% since the start of August and 14.42% from its opening price of $0.833 on Monday.
Cardano Performance In the Previous Cycle Compared to Now
Nevertheless, despite its recent price correction and a poor outing in general since the start of 2025, Cardano has posted a substantial upside since the last bear market ended in 2022. For context, after receding 81% in 2022, ADA regained bullish momentum in 2023, growing 141% from around $0.246 to $0.594.
Also, the momentum endured last year, with ADA rallying another 42% to $0.844. Remarkably, it reached a high of $1.32 before correcting to the closing price last year.
However, compared to its previous cycle, Cardano has underperformed so far. Market data shows that ADA rallied a jaw-dropping 18,488% from its lows of $0.07 in 2020 to its all-time high of $3.16 in September 2021. This makes the current 500% rally from the low of $0.22 in 2022 to a high of $1.32 in 2024 negligent compared to the previous uptick.

Pattern Suggests Similarities in the Two Cardano Cycles
Analyst Ali Martinez highlighted on August 1 that Cardano is forming a similar price structure now to the last cycle. While he noted that it is unfolding more gradually this time, Martinez indicated that we might be early to an explosive price development for Cardano.
For perspective, after the high of $1.35 in 2018, ADA made lower lows and lower highs to the 0% Fibonacci level at $0.018. However, before reaching the bottom, according to Martinez’s accompanying chart, Cardano found support within a price range.
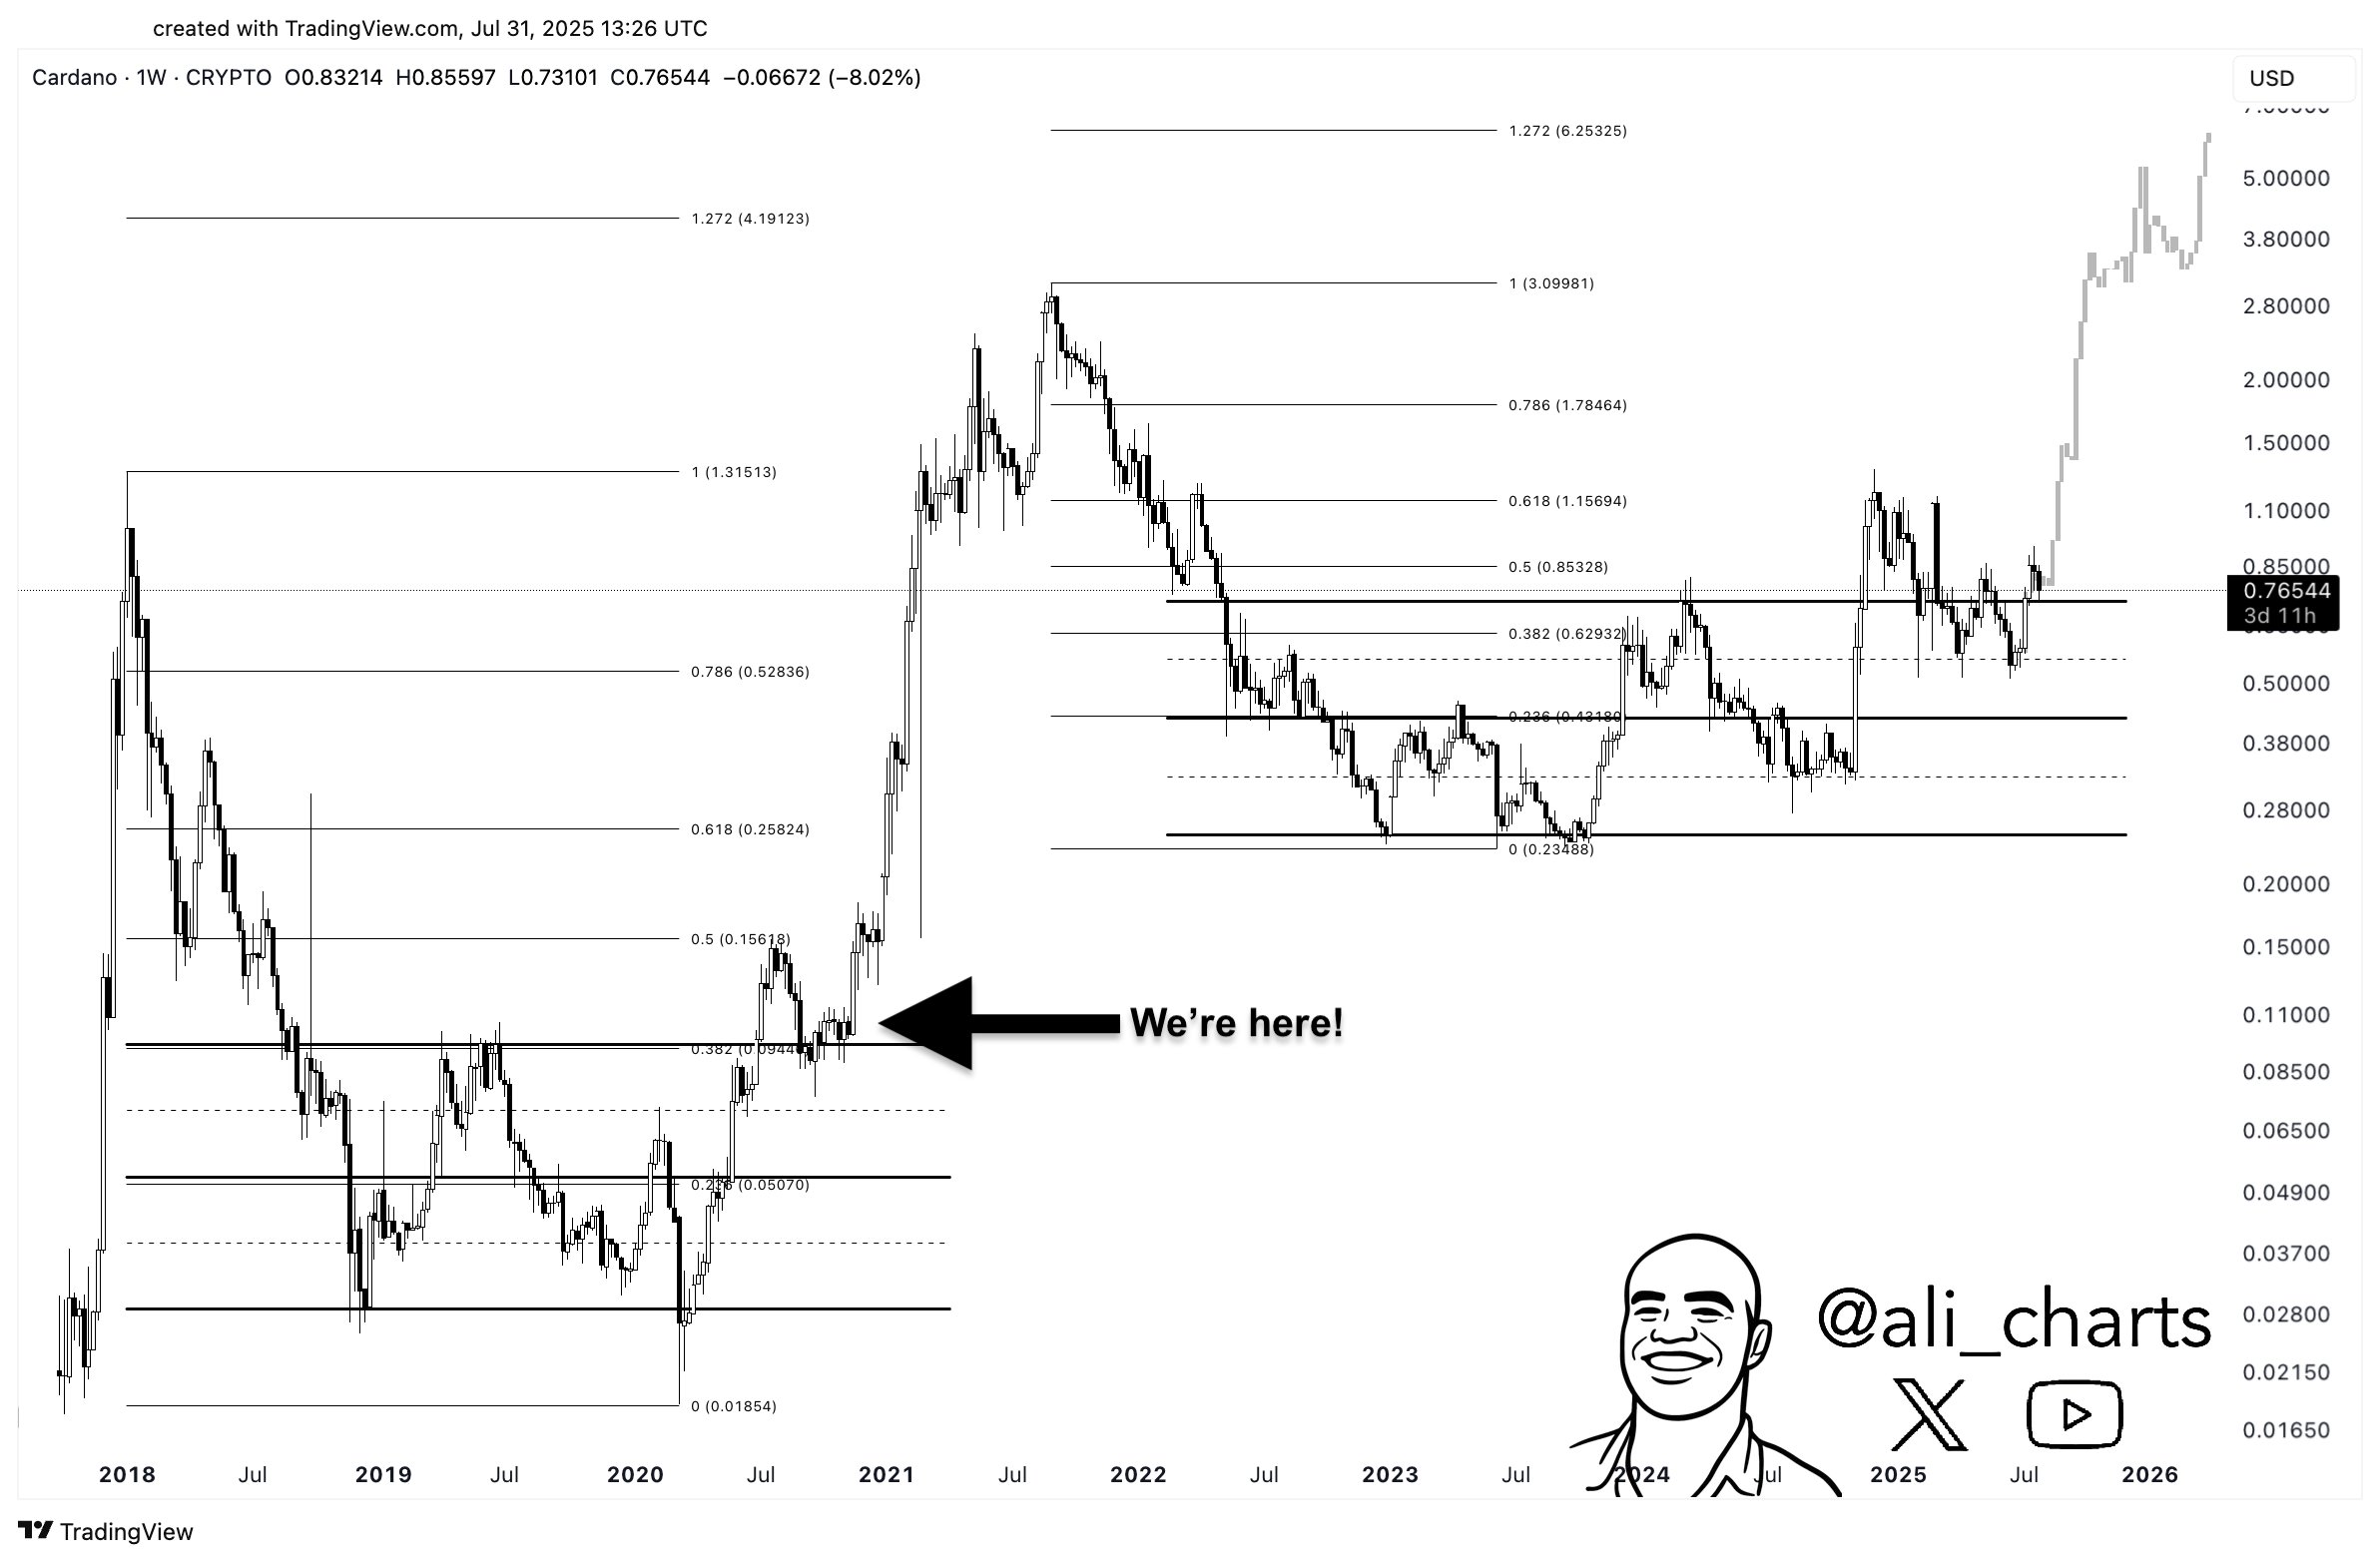
The upper resistance of the price range is slightly above the 0.382 Fibonacci at $0.094, the mid-range is around $0.051, and the lower support is at $0.027. After the short-lived dump to $0.018, ADA regained bullish momentum, breaking above the range to new highs. The momentum continued to its current all-time high.
Meanwhile, Martinez identified a similar price development in Cardano’s recent price action. After the 2021 high, ADA retraced considerably to enter another range identical to that seen between 2018 and 2020.
The support at $0.24 served as the lower boundary, the 0.336 Fibonacci level at $0.431 as the mid-range, and $0.81 as the upper resistance. Notably, ADA has been ranging within this channel since early 2022 but saw an unsustainable breakout with the rally to $1.32 in December 2024 before falling back in.
Analyst Predicts the Price of ADA Even at a 50% Pump
Deezy quoted Martinez’s post on Friday and predicted the price of Cardano if it rallies 50% less than it did from this point in the previous market. An accompanying chart shows that ADA rallied by 3,031% from the upper boundary of last cycle’s range to an ascending trendline, adding $2.82 to its price to culminate in its current all-time high of $3.16.
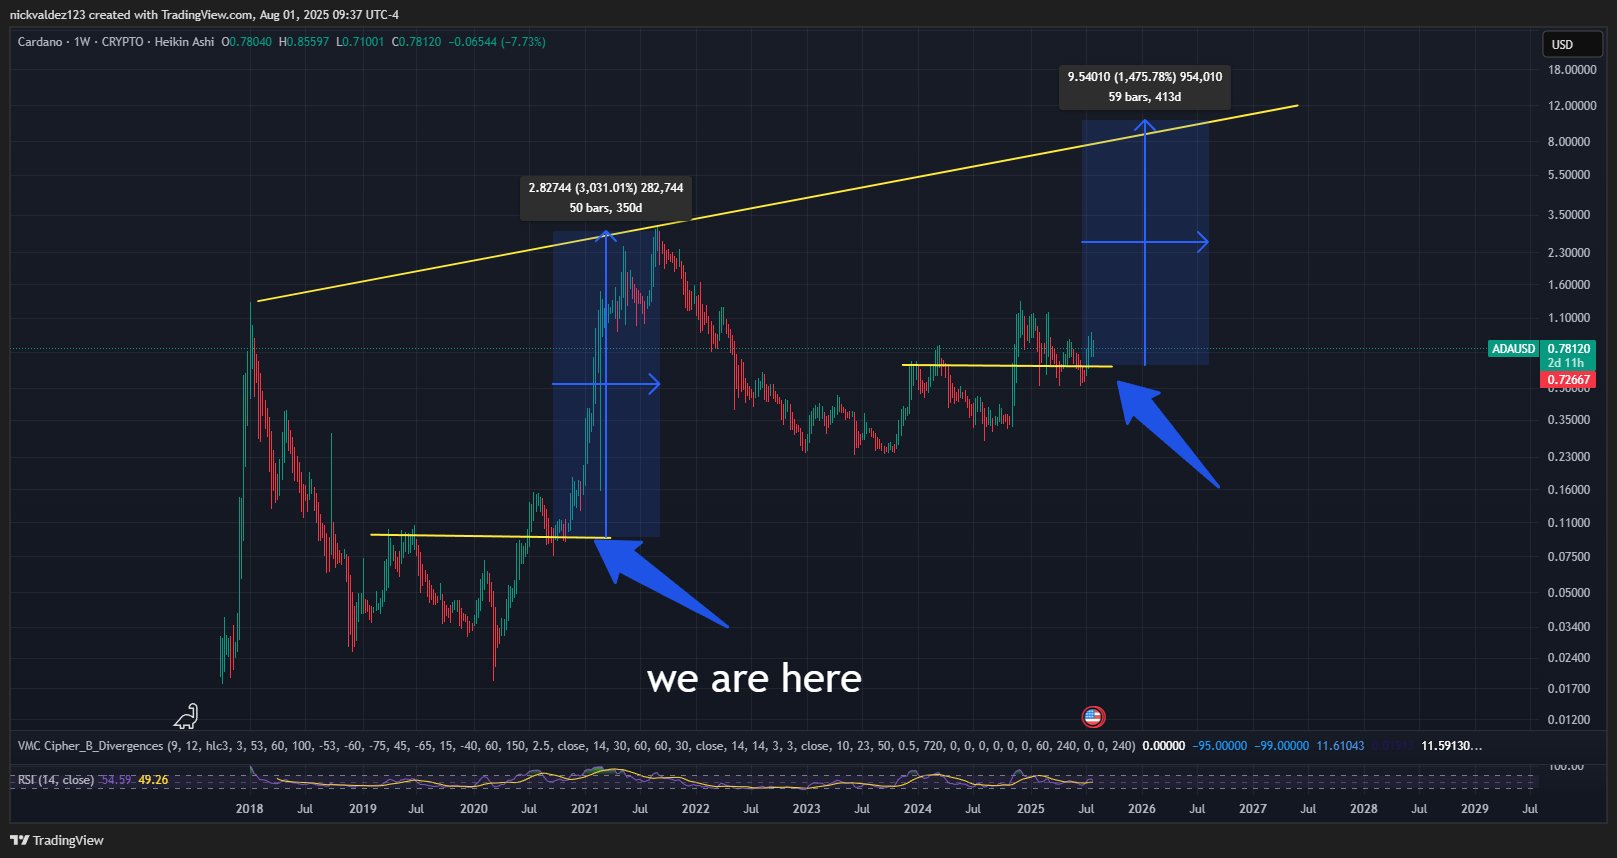
Interestingly, the analyst noted that it would still be a bullish scenario for ADA if it mirrors even 50% of the price growth from this point in the previous cycle. Specifically, the chart shows that ADA would rally by 1,475%, adding $9.54 to its current price of $0.718. This could result in a new all-time high of $10.25.
Remarkably, this projection aligns with the price outlook from Ssebi and Cardano permabull Dan Gambardello.
DisClamier: This content is informational and should not be considered financial advice. The views expressed in this article may include the author's personal opinions and do not reflect The Crypto Basic opinion. Readers are encouraged to do thorough research before making any investment decisions. The Crypto Basic is not responsible for any financial losses.