Bitcoin is holding a bullish technical structure after completing a 5-wave impulse, according to XForce Global. The analyst now expects a short-term correction before the next leg higher.
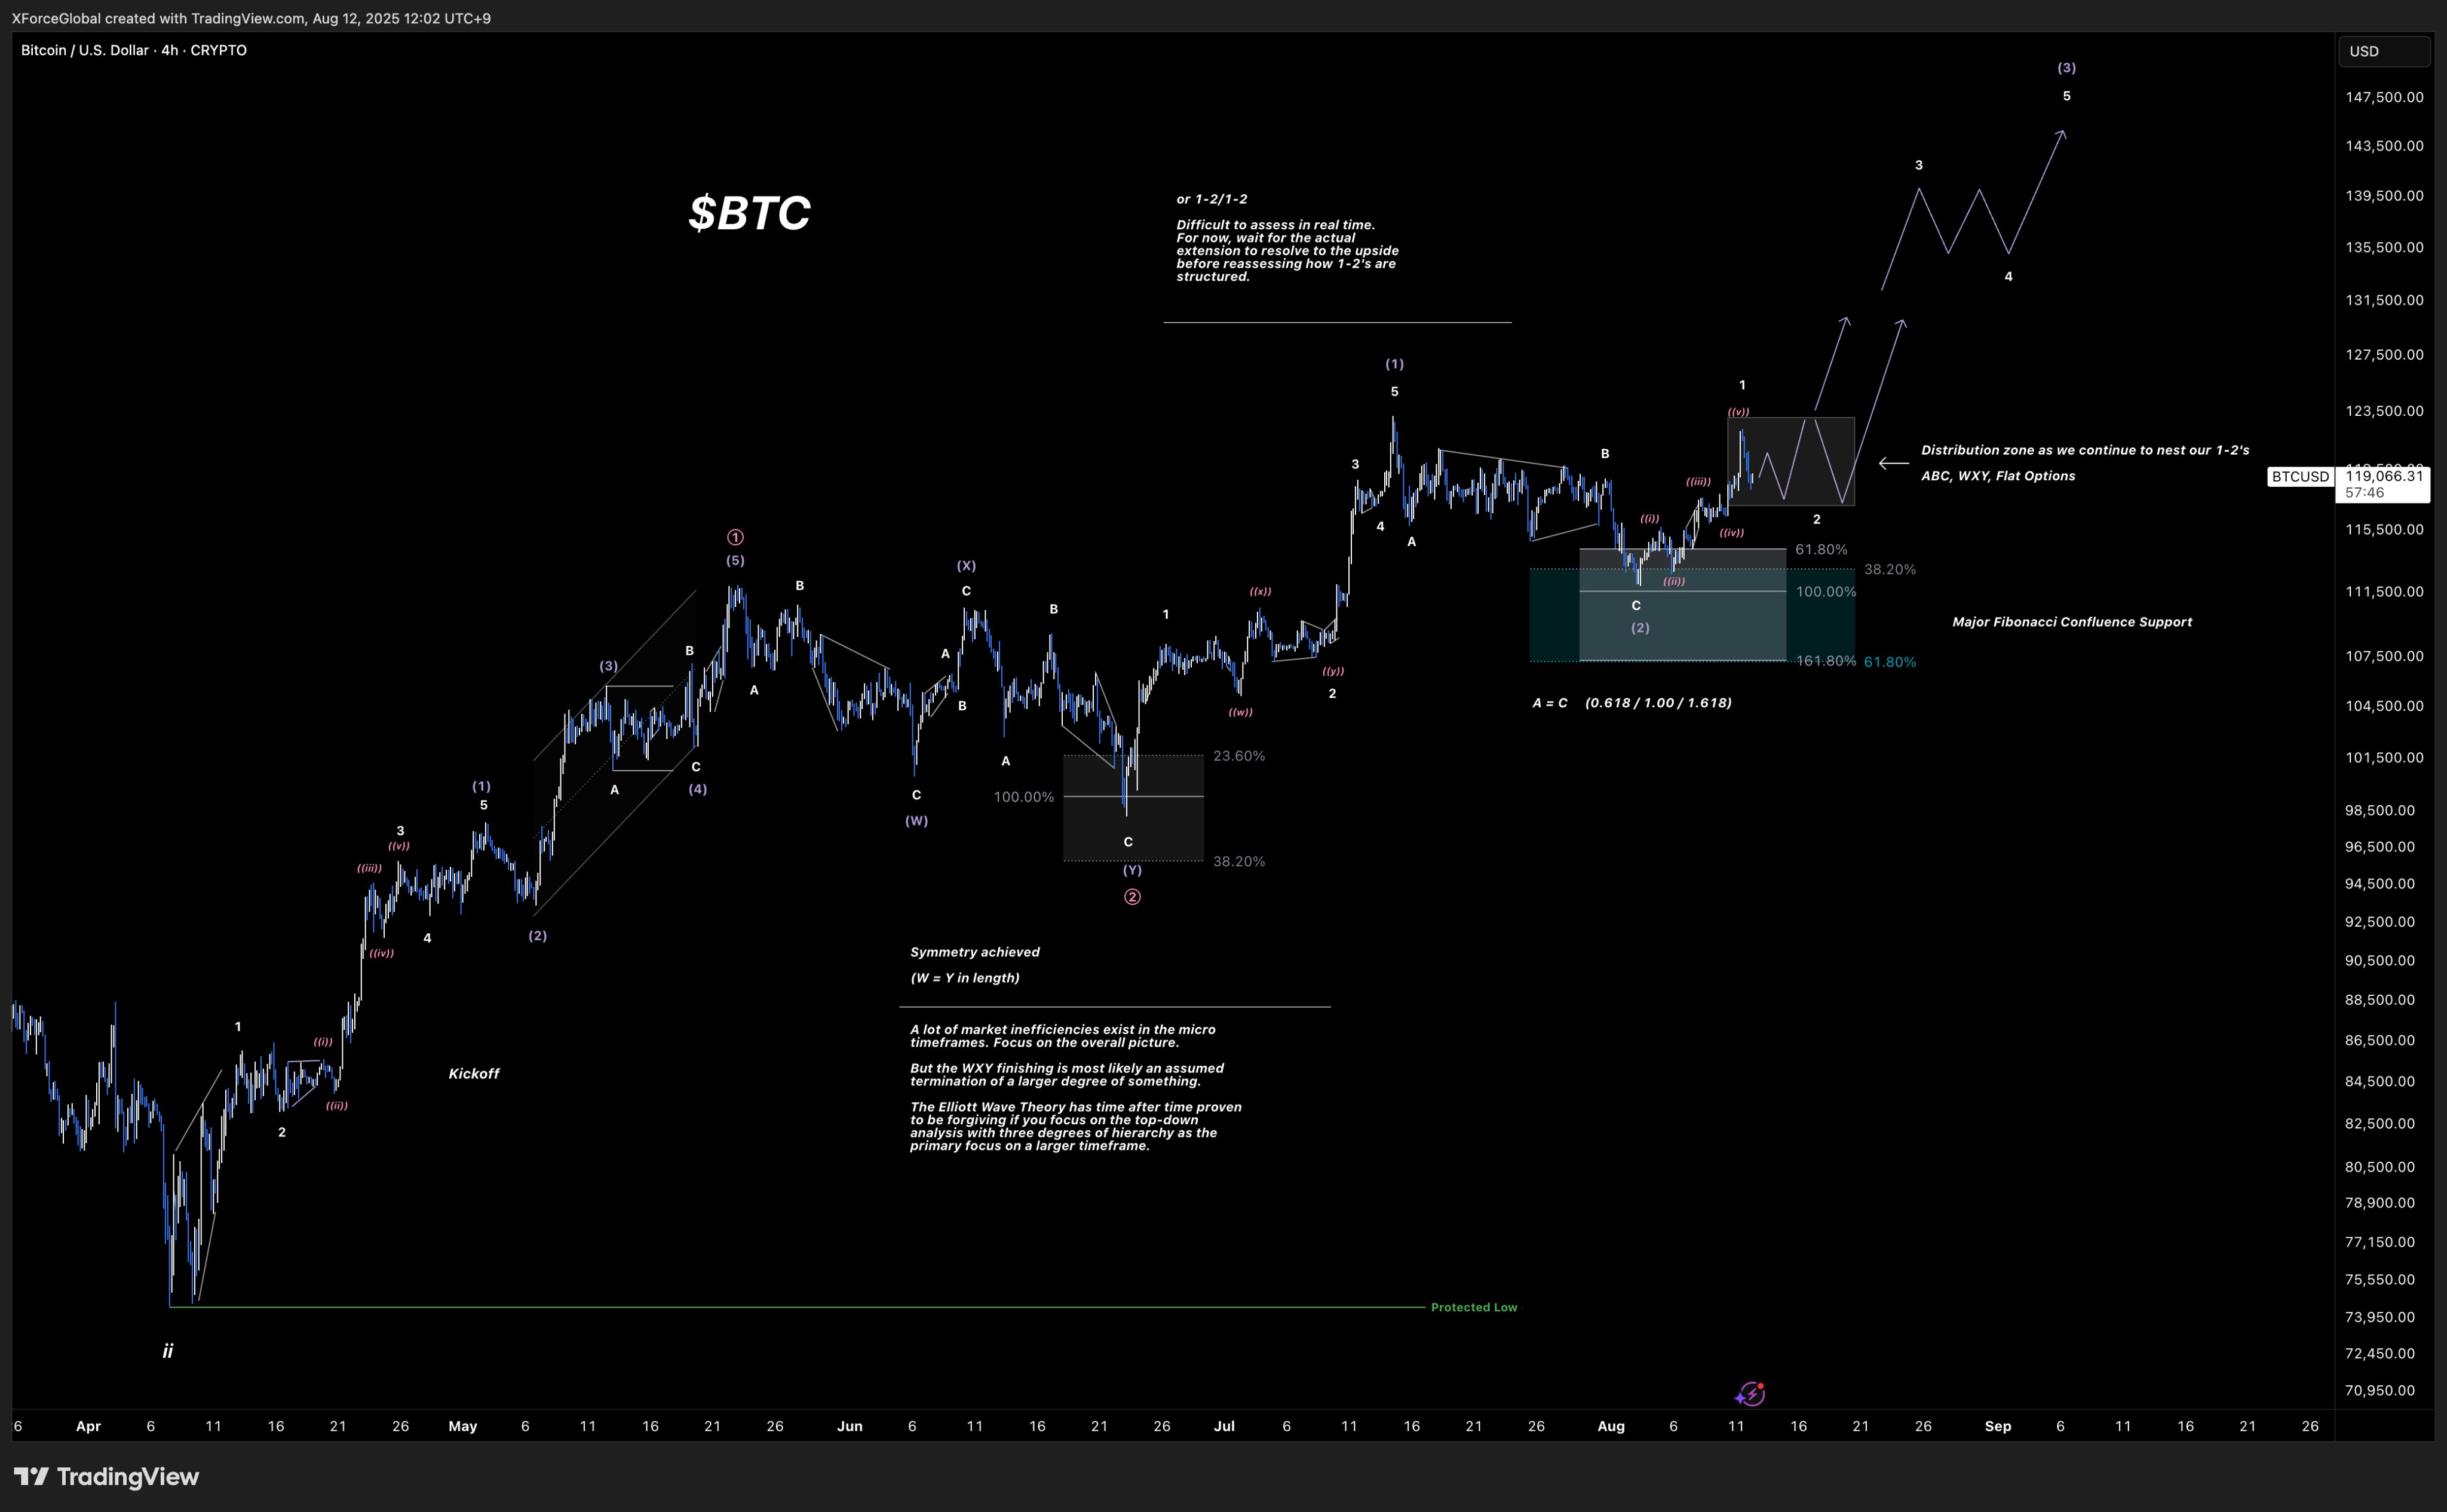
The analyst shared technical charts on X, showing Bitcoin completing a clean 5-wave impulse from the $112,000–$122,000 zone. As of this press, Bitcoin trades at $118,721, a 2.7% decline in the past day, reducing its weekly gain to 3.8%.
XForce Global considers the move a bullish confirmation because its structure and timing match the characteristics of an impulsive rally rather than a corrective rebound, despite the potential for short-term pullbacks.
Bitcoin Local Correction and Support Zones
The analyst noted that the immediate market focus is on Bitcoin’s ongoing local correction. According to the technical patterns, Bitcoin is currently hovering above the 38.2% Fibonacci retracement level around $115,500.
This level coincides with the lower boundary of the short-term uptrend channel and serves as the first major area where buying interest could intensify.

Deeper retracements could extend toward the 61.8% Fibonacci level at approximately $107,500. Both $115,500 and $107,500 are critical supports that align with Fibonacci confluence zones. A sustained move above these levels will keep the bullish wave count intact, allowing for the possibility of an upward continuation without significant structural damage.
Notably, a “protected low” exists at $75,000. This acts as the broader invalidation point for the bullish outlook, meaning that a break below this level would negate the current wave count.
Key Short-Term and Long-Term Levels
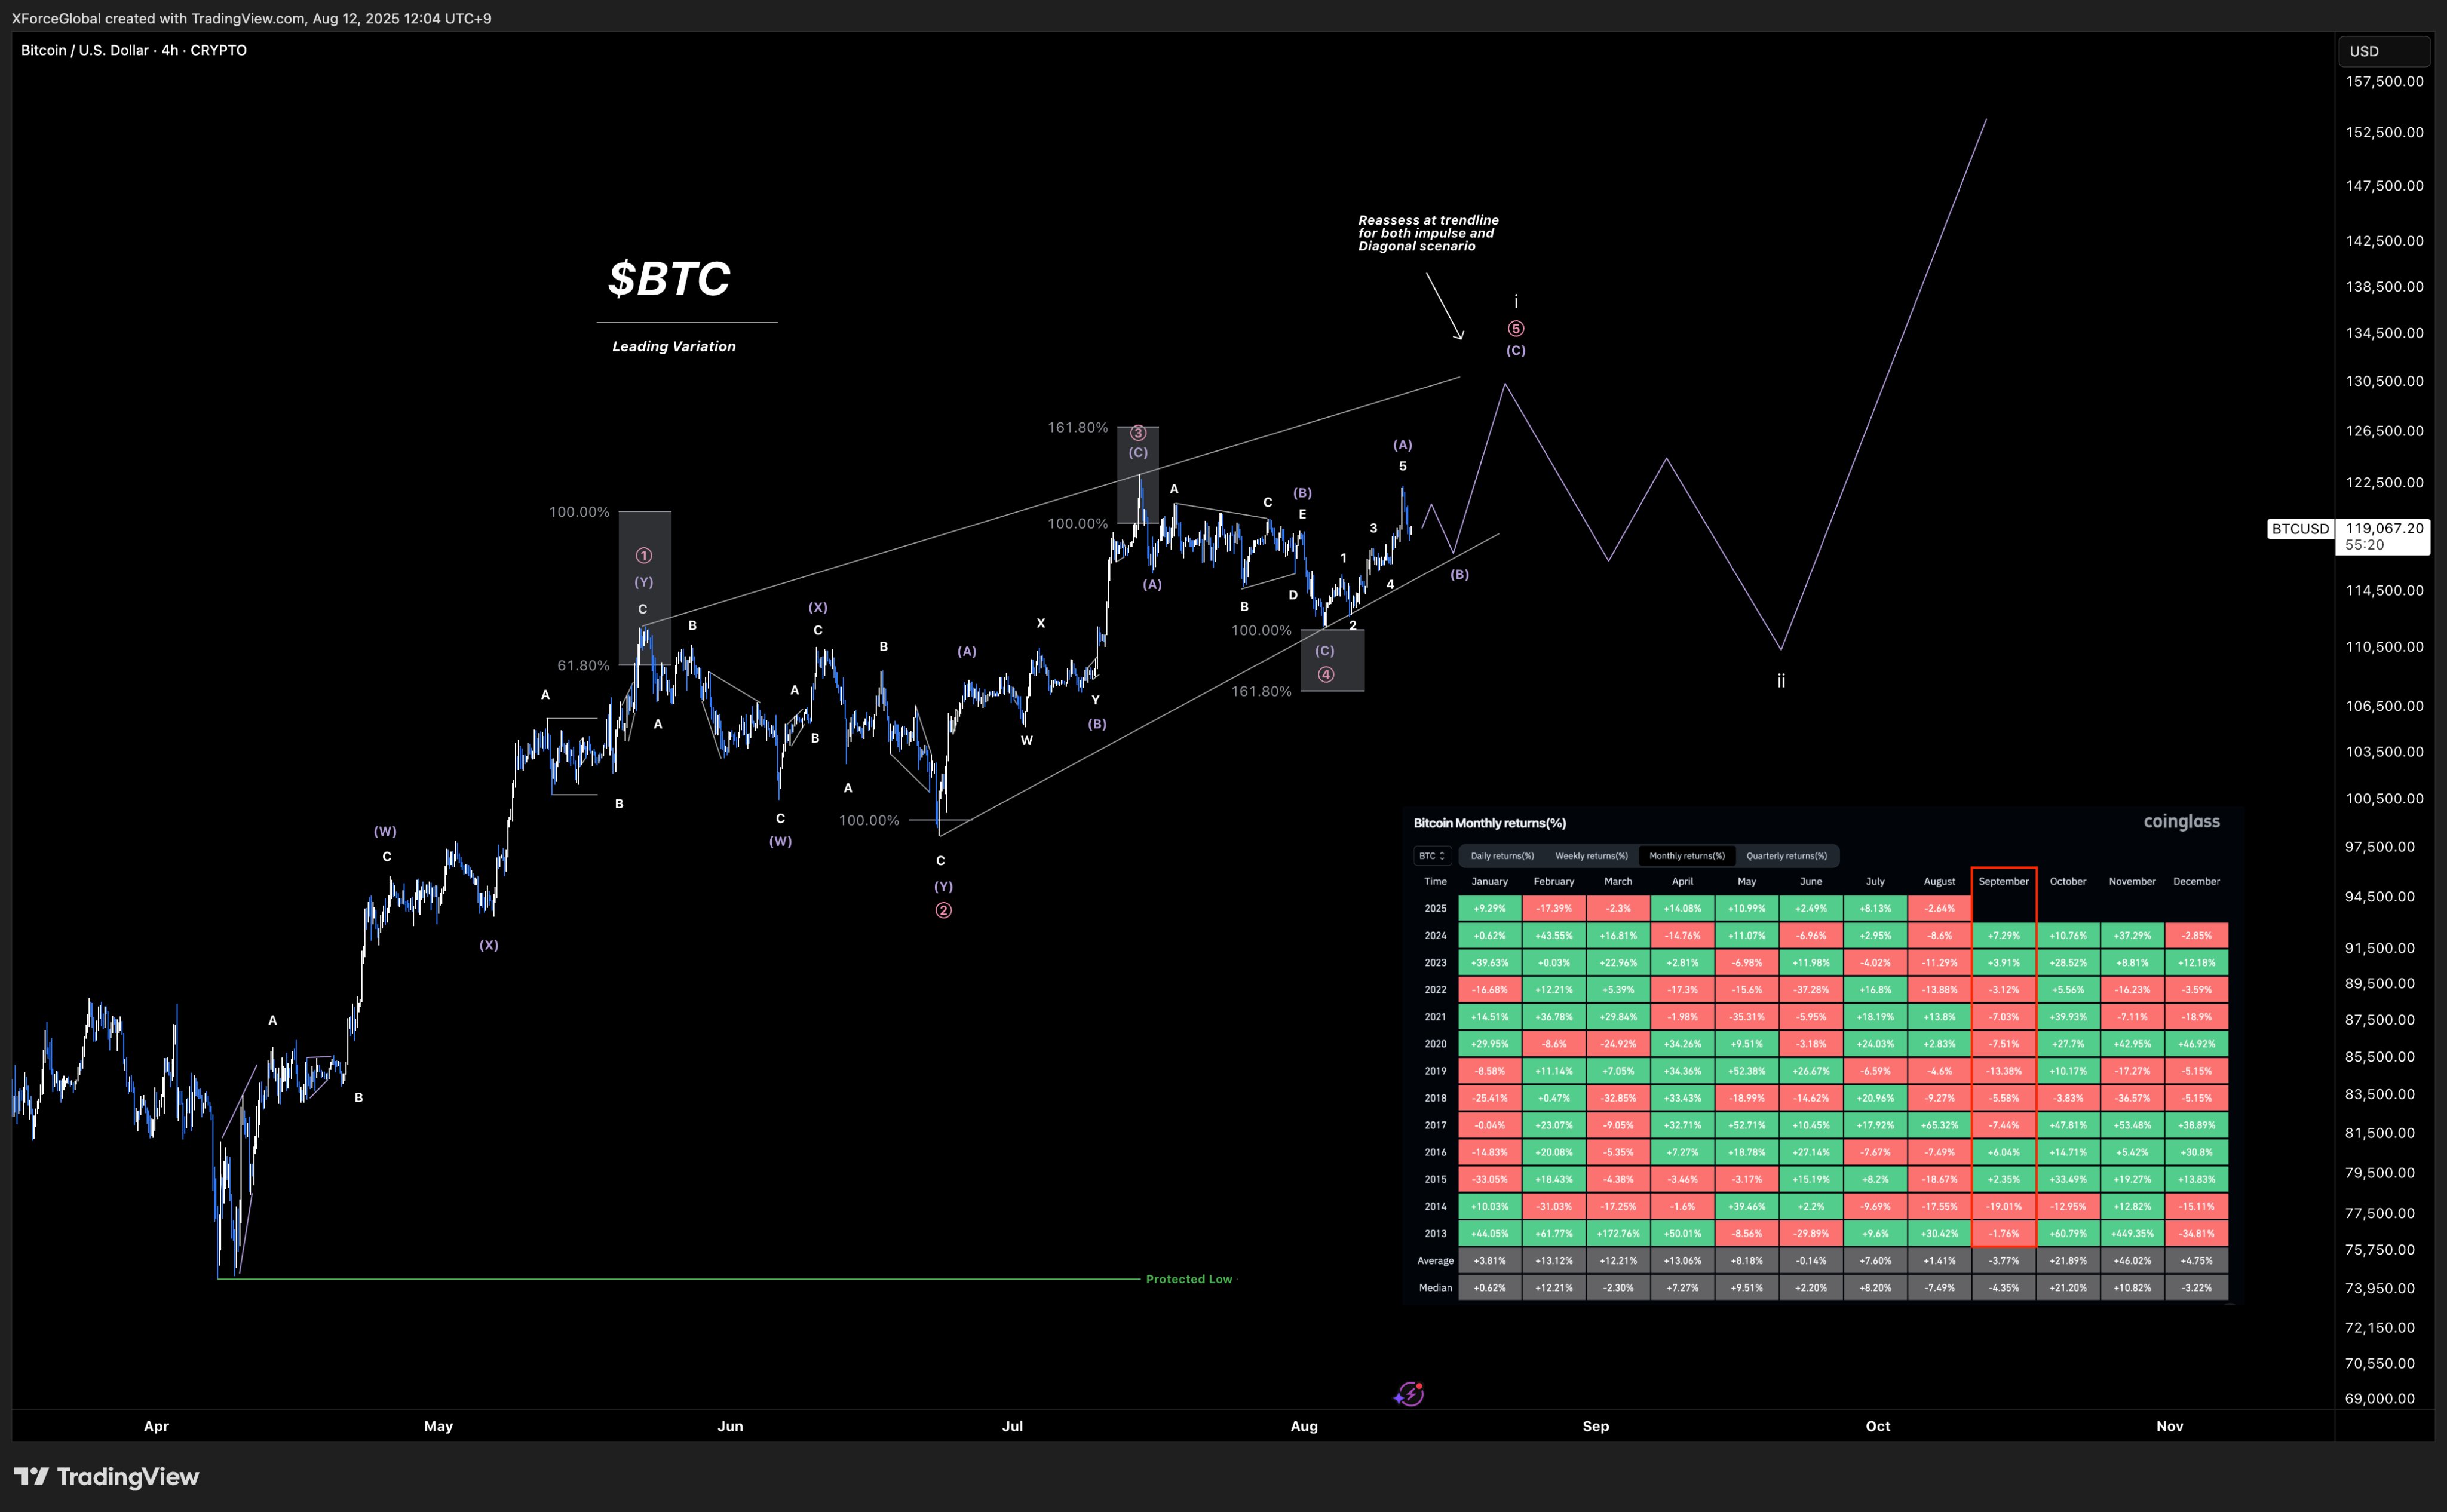
Meanwhile, the charts reveal a short-term distribution zone between $121,000 and $123,500. Price action within this range could form a base for potential nesting of smaller degree 1-2 wave structures ahead of the next upward movement.

If support levels hold and the correction completes as projected, the next upside target range is between $140,000 and $148,000, marked as a larger degree wave (3) in the Elliott count.
Two Scenarios in Play for August
For the month of August, XForce Global is monitoring two hybrid scenarios. The first is a standard impulse wave continuation, in which Bitcoin maintains a strong trending structure.
However, the second is a leading diagonal variation, where price action advances within converging trendlines, often signaling a measured but sustained climb.
In both cases, XForce Global expects that investors will buy the dips, supporting the continuation of the trend. The trendline drawn on the charts remains the key decision point for validating or adjusting the forecast.
Other Analysts Weigh In
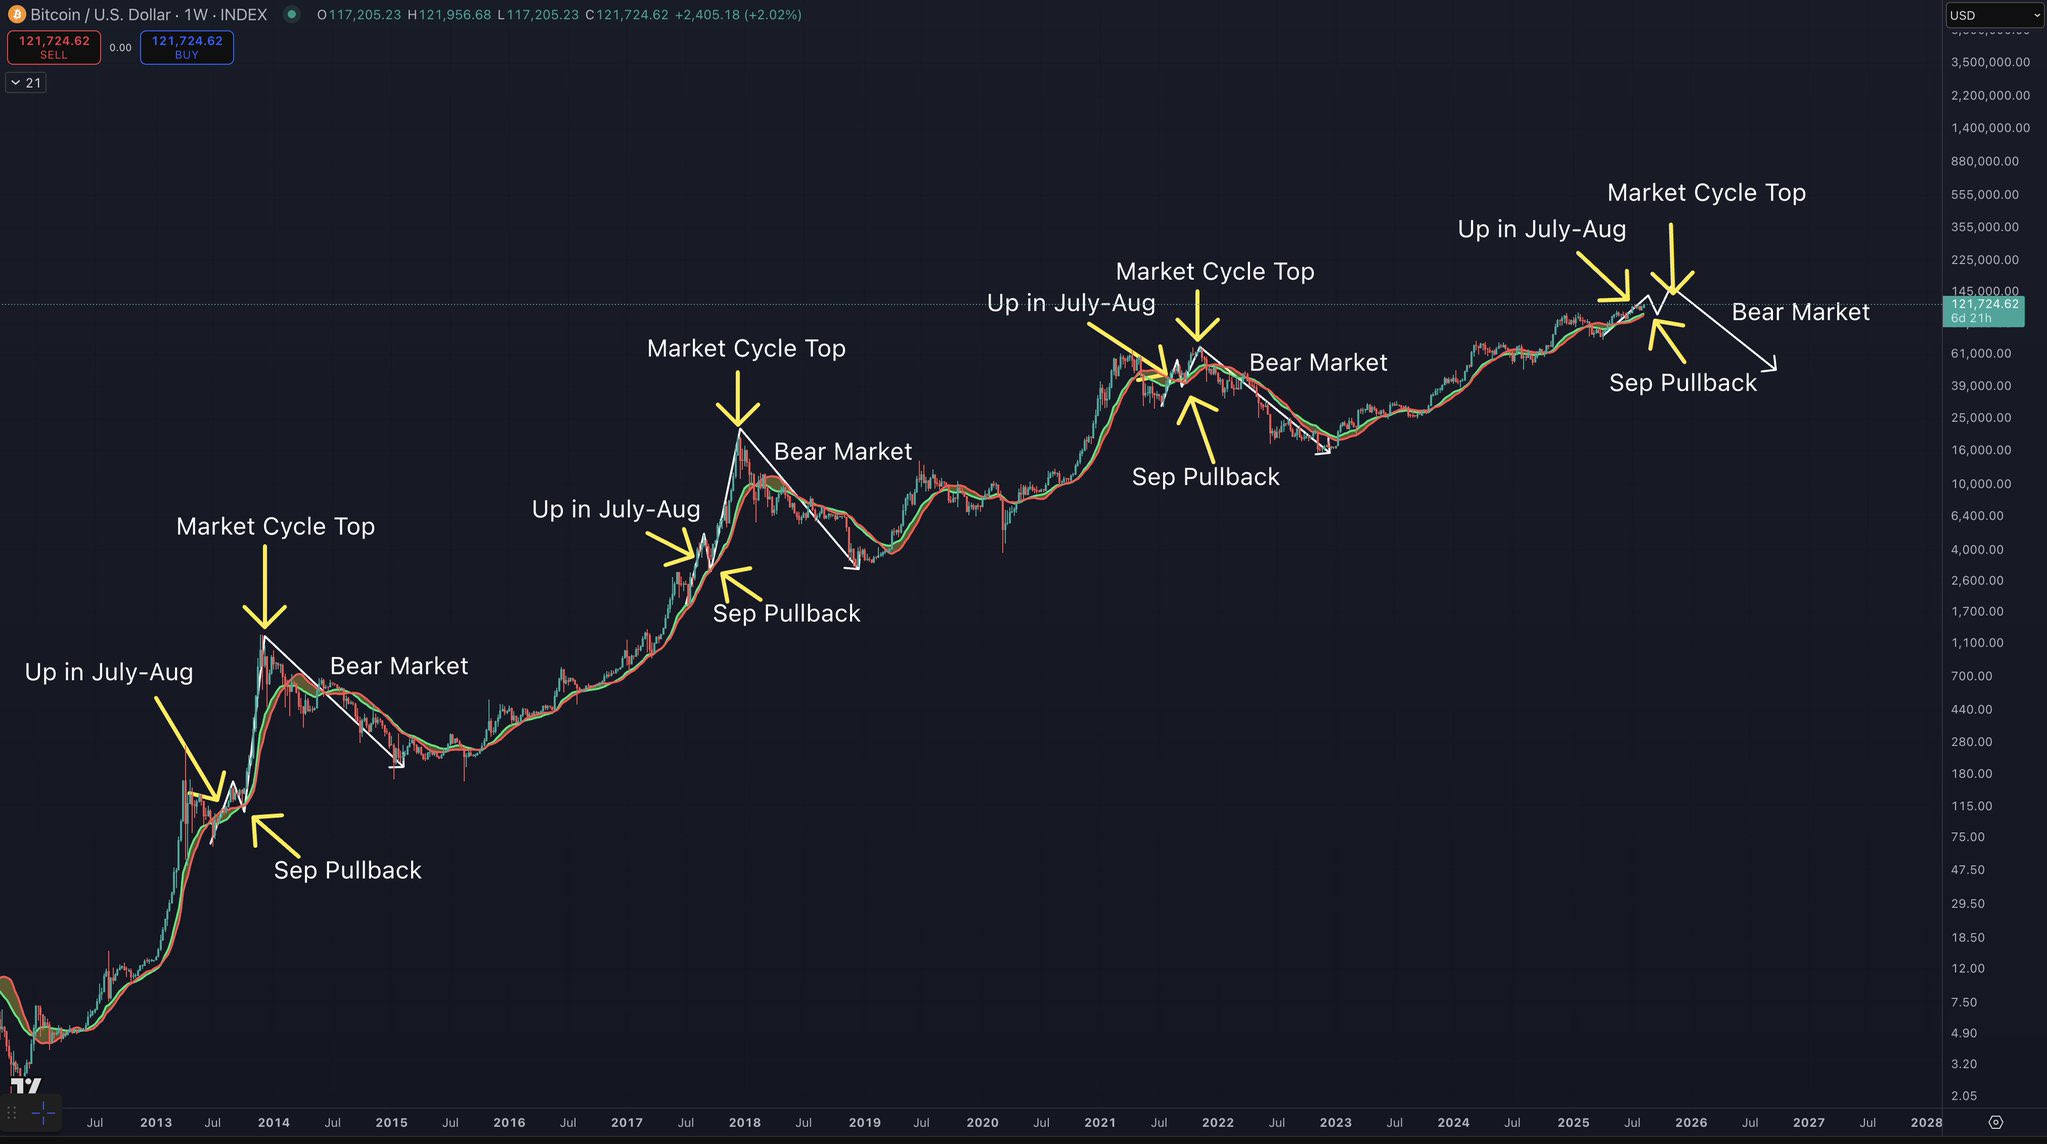
Meanwhile, in a separate analysis, trending Bitcoin shared a weekly Bitcoin chart indicating that the current bull market is in its early stages. The chart highlights a recurring pattern across past cycles, where gains in July and August typically leads to a September pullback, the formation of a market cycle top, and the start of a bear market.

In the present cycle, now in August, Bitcoin trading below $121,000, with annotations marking July–August strength and signalling a potential September decline before a cycle peak.
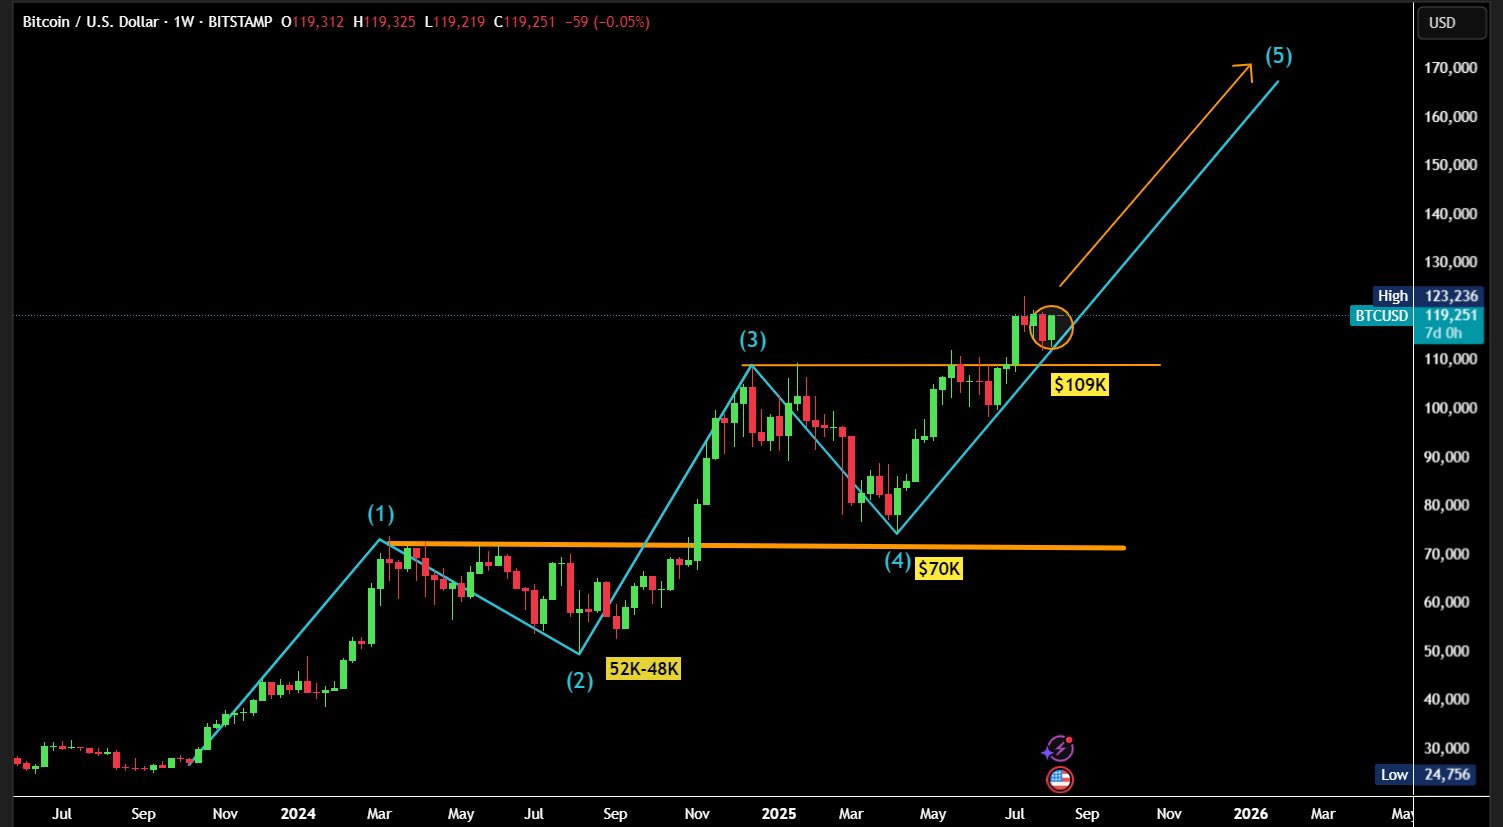
Further, Bull Theory posted on X that Bitcoin’s weekly chart shows a successful breakout retest above $109K, with sellers unable to push the price back below this level.
The pattern features an initial red candle marking a pullback, followed by a strong green candle closing near the top, indicating sustained buyer support. This setup, resembling a bullish harami or breakout confirmation, suggests that a move above the previous high could propel Bitcoin toward $123K and higher up to $170K.

Notably, analyst CrediBULL had earlier forecasted Bitcoin could climb to $150,000 once its ongoing Elliott Wave 5 pattern concludes. He noted the wave began in September 2024 and was strengthened by a Q4 rally linked to Donald Trump’s election campaign.
Similarly, Tom Lee of Fundstrat predicted Bitcoin could exceed $150,000 in 2025, citing rising institutional adoption. He downplayed February’s drop from $102,000 to $78,000 as a normal cycle and warned against market timing, noting Bitcoin’s gains often occur in short bursts.
DisClamier: This content is informational and should not be considered financial advice. The views expressed in this article may include the author's personal opinions and do not reflect The Crypto Basic opinion. Readers are encouraged to do thorough research before making any investment decisions. The Crypto Basic is not responsible for any financial losses.


