

Shiba Inu is consolidating within a long-term weekly triangle pattern, with an analyst watching for a breakout as price nears critical support and resistance levels.
A chart from Crypto Crew University shows Shiba Inu trading in a multi-year weekly triangle pattern. The analyst suggests a potential price surge with chart analysis highlighting a breakout target of $0.000150 if price clears the resistance zone and momentum strengthens.
Shiba Inu Current Price and Key Levels
Shiba Inu trades at $0.00001309, a moderate 0.6% rise in the past day. The token has now seen a 5.9% uptick in the past week, reducing the monthly deficit to 2%. Chart analysis reveals Shiba’s immediate support sits at 0.00001045.
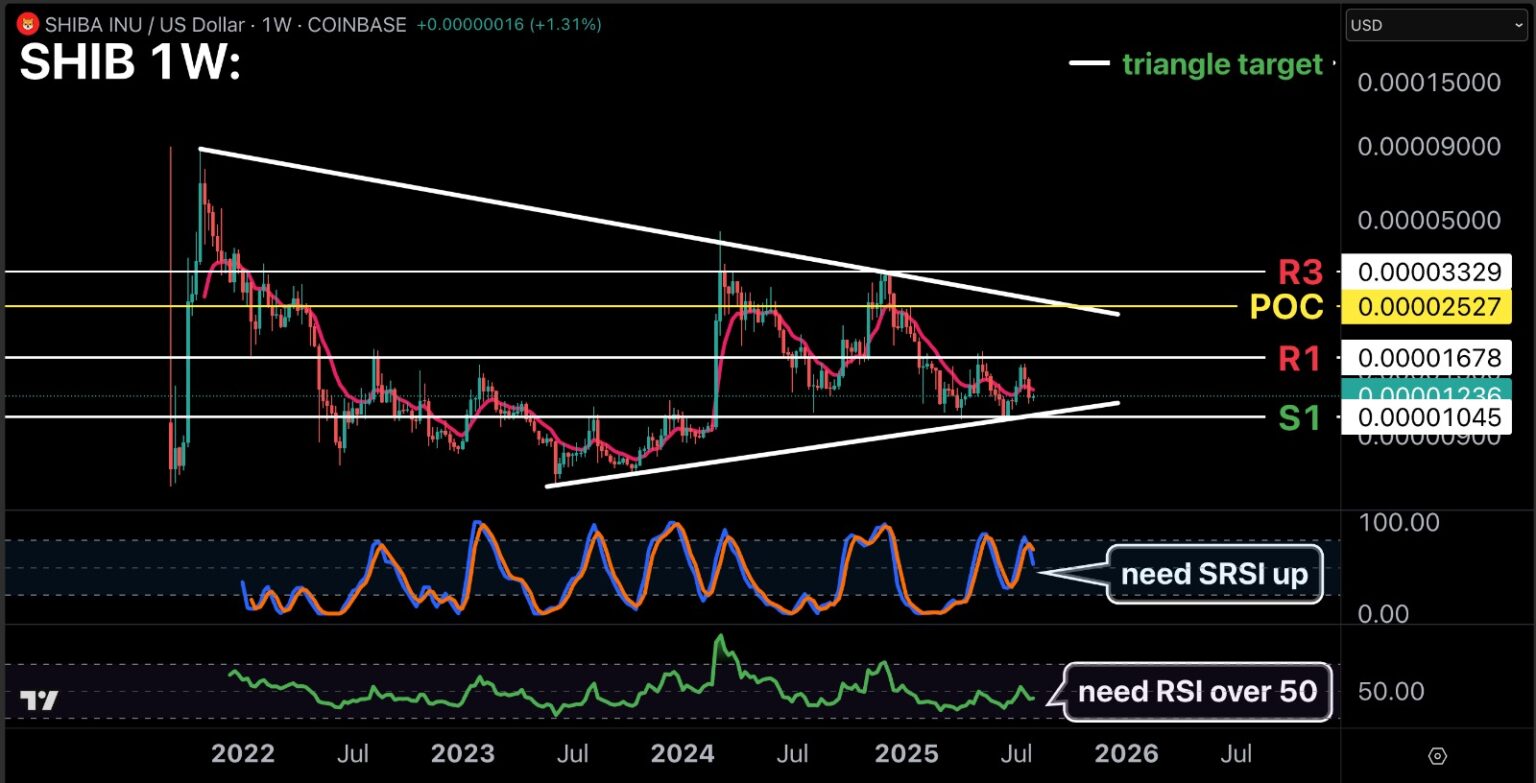
Notably, Shiba Inu’s first resistance zone stands at 0.00001678, and a point of control (POC) level is highlighted at 0.00002527. An additional resistance appears at 0.00003329. For context, Shiba Inu has not traded above 0.00003 since December 5, 2024.

A breakout above the first resistance level and POC could lead toward the annotated triangle target of 0.00015, representing a new all-time high. From the current price, that move would represent a gain of approximately 1,053%. For context, Shiba Inu’s all-time high was 0.00008616, recorded in October 2021.
RSI Points to Shiba Inu’s Bullish and Bearish Scenarios
Interestingly, the chart also features the stochastic relative strength index (SRSI) and the standard RSI to assess momentum. Currently, both indicators are trading below thresholds, signaling that buying strength remains limited.
A bullish scenario could play out if SHIB secures a weekly close above the triangle’s upper boundary at the first resistance, ideally accompanied by the RSI crossing 50 and the SRSI trending higher. This would validate the measured move projection toward $0.000150.
In contrast, a bearish outcome would be triggered if the price closes below the ascending trendline or drops under S1, potentially opening the way for deeper declines toward lower support levels.
Other Analyst Predicts Shiba Inu’s Price
In a separate analysis, a pseudonymous analyst, Best Crypto, is anticipating a bullish move for Shiba Inu, highlighting strong accumulation and favorable market trends on the weekly chart.
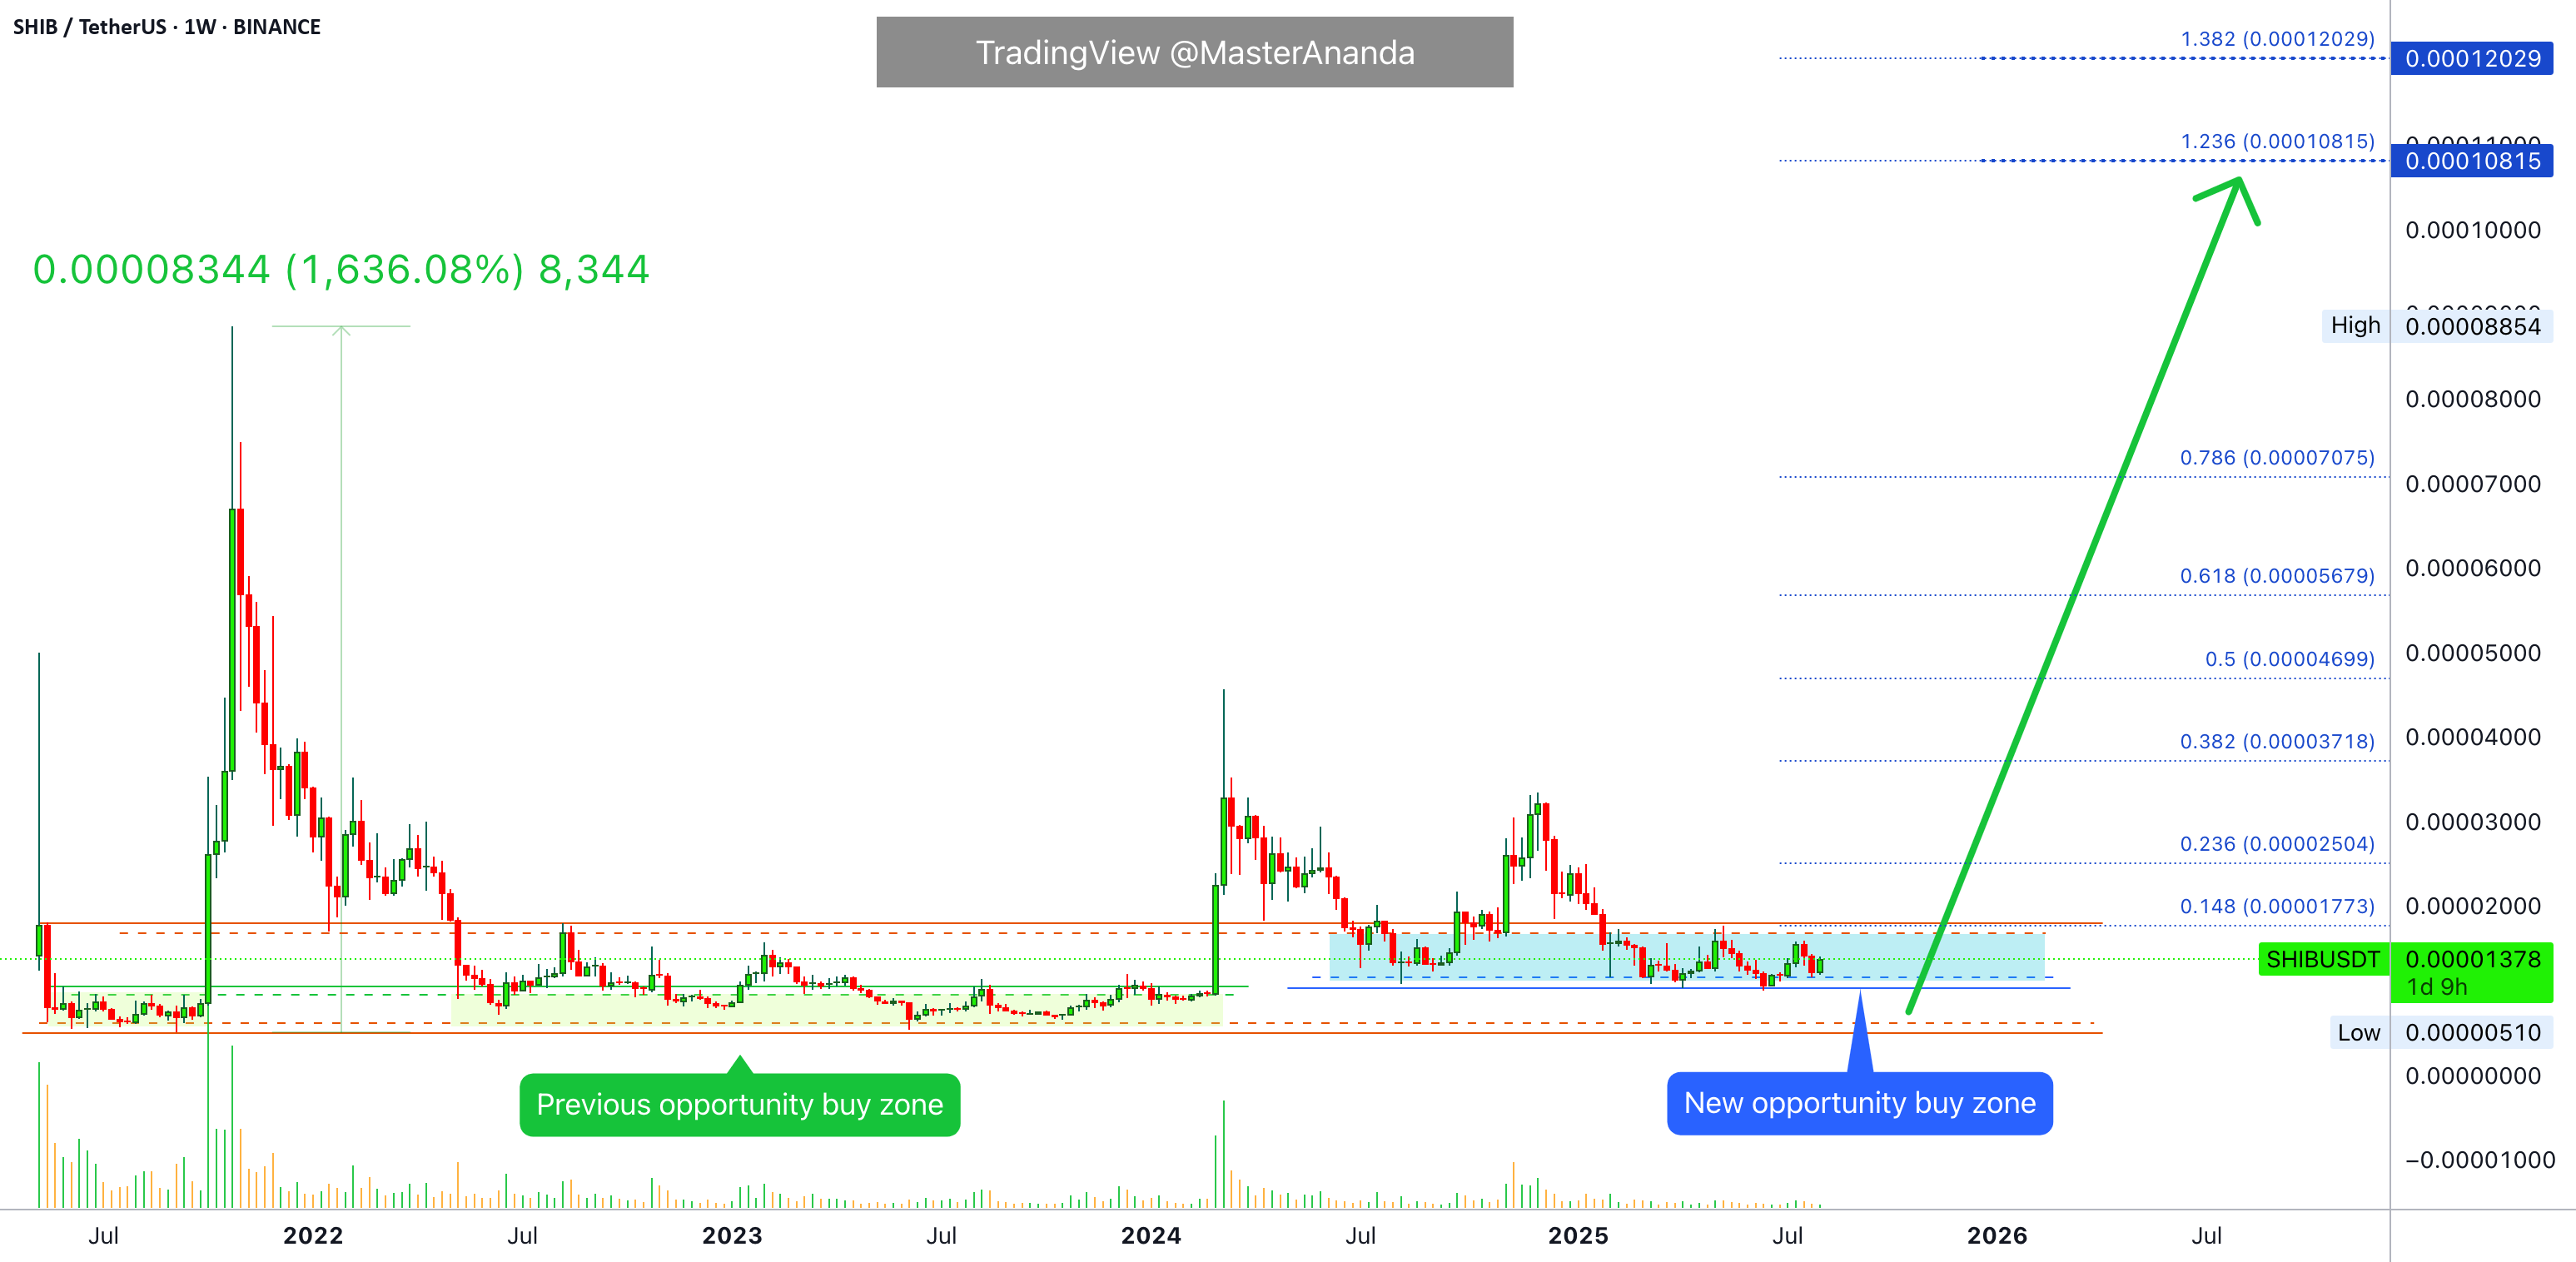
The chart, which also references notable volume surges during SHIB’s 2021 peak and 2024, shows SHIB within what it calls a “new opportunity buy zone,” with immediate resistance levels noted at $0.00001773 and $0.00002504.
A key support level exists near $0.00000510, while Fibonacci extension targets point to potential highs of $0.00010815 and $0.00012029, representing gains of roughly 685% and 773% from current levels.
Interestingly, analyst Crypto Nuclear had earlier predicted a similar rally. He noted that if Shiba Inu retest and hold a key demand zone between $0.00001090 and $0.00001190 could spark a rally toward $0.00001940, $0.00002400, and $0.00003338, with long-term targets at $0.00007870 and $0.00008836, over 580% above current prices.
Meanwhile, analyst Javon Marks is forecasting a potential 156% rise toward $0.000032 as Shiba Inu confirmed a bullish divergence on its two-day chart.
DisClamier: This content is informational and should not be considered financial advice. The views expressed in this article may include the author's personal opinions and do not reflect The Crypto Basic opinion. Readers are encouraged to do thorough research before making any investment decisions. The Crypto Basic is not responsible for any financial losses.