




Cardano (ADA) Breaks Higher Toward $0.255 as ADA Tests Major Technical Resistance.
The Crypto Basic found that ADA is accelerating toward $0.255 after a series of higher lows and higher highs. The latest candles represent a sharp expansion from the recent consolidation around the $0.20–$0.22 region, bringing ADA back to an important technical area.
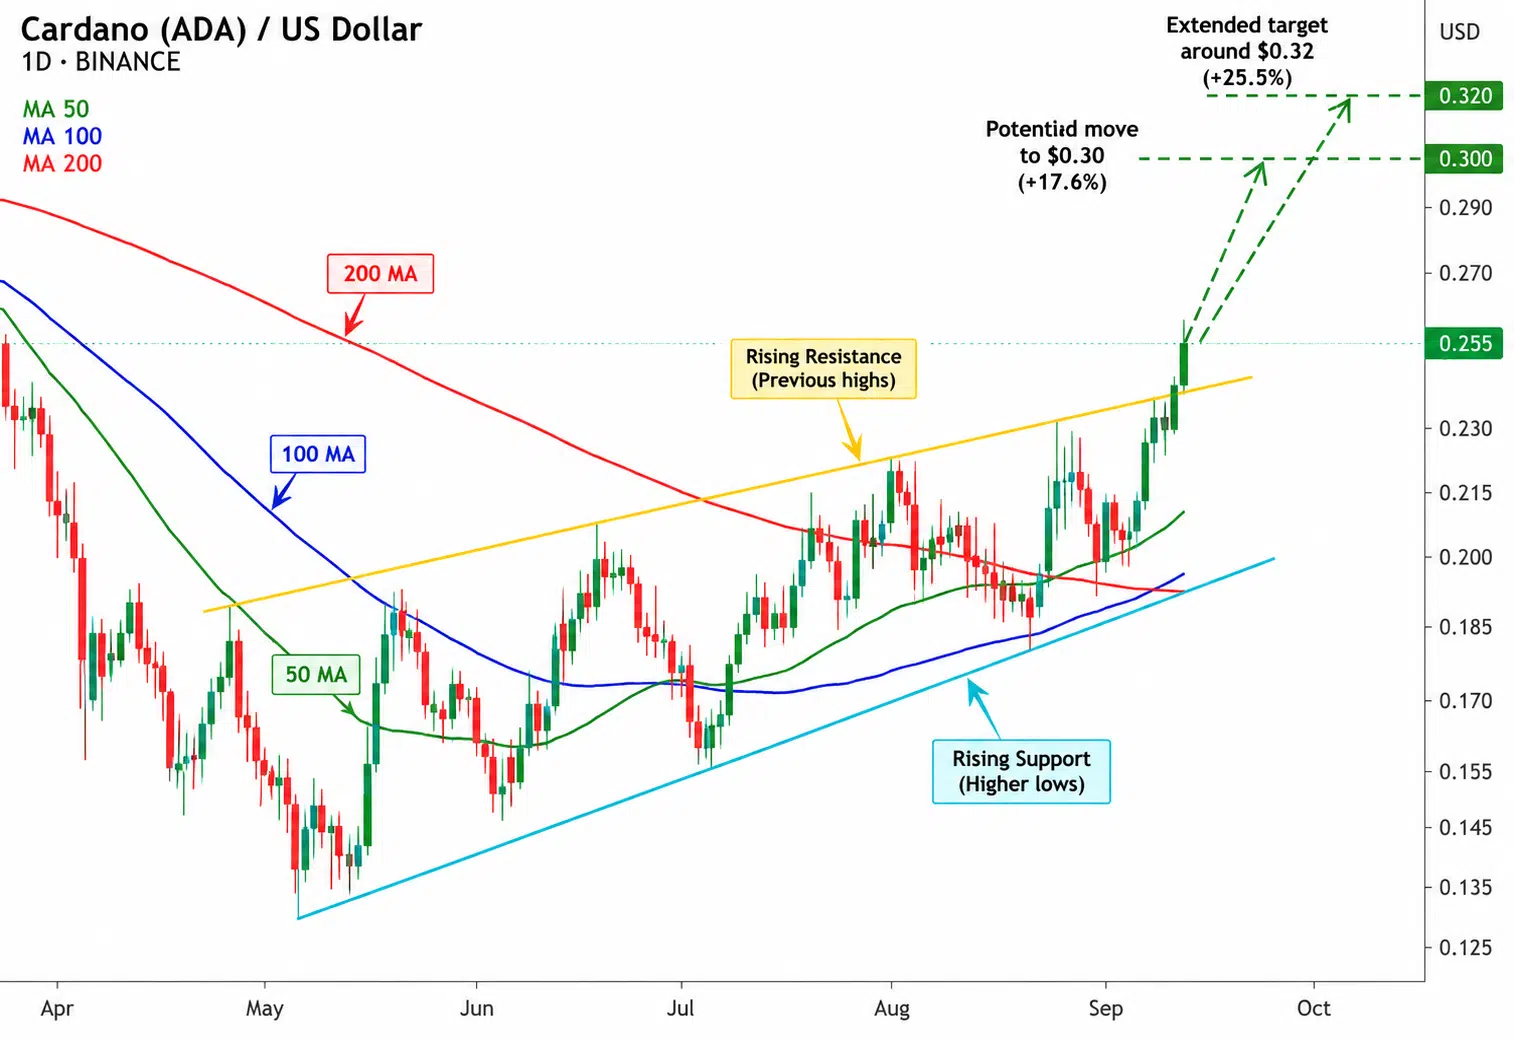
The chart contains two rising trendlines. The lower cyan trendline connects the major lows beginning around $0.135 and continues through subsequent higher lows near $0.16, $0.175, and approximately $0.195. This establishes the broader rising price structure.
The upper yellow trendline tracks resistance across the recovery. ADA’s latest move has pushed above this line, with price reaching approximately $0.255.
Moving Averages Turn Higher
The chart also displays three moving averages. The shorter green average has turned upward sharply, and price is trading above it. The blue moving average has also begun rising following its earlier decline.
The longer red moving average remains important. It had been falling throughout the previous downtrend, but the latest advance has taken ADA above the red average, marking a change from the earlier structure where that line repeatedly remained over price.
Price is now above all three displayed moving averages.
Latest Five Candles Show Increasing Buying Pressure
The latest five candles show a clear change in momentum.
The sequence begins around the $0.20 region, where a lower wick was followed by a strong recovery. Subsequent green candles pushed through approximately $0.215 and $0.23.
The newest candles expanded further toward $0.255, with relatively large green bodies. The latest candle is positioned close to its upper range, showing that the advance had not experienced a substantial intraday retracement at the moment captured by the chart.
No volume panel is provided, so the move cannot be assessed using trading-volume confirmation.
What Would $0.30 Mean From Here?
The supplied commentary identifies the $0.30s as a possible short-term projection. That level is not yet shown as completed price action.
From the chart’s approximately $0.255 price, reaching $0.30 would require another 17.6% increase. A move to $0.32 would represent approximately 25.5%.
Structurally, the chart shows ADA moving from a previous markdown into a recovery characterized by higher lows, rising moving averages, and a break above the upper rising resistance line. The $0.30–$0.32 area remains a projection from the supplied thesis rather than a level already reached by the candles.