




ChartNerd has revisited a long-term XRP structure that compares the asset’s current multi-year support pattern with the accumulation cycle that preceded its 2017 expansion. The model focuses on an upward-sloping support line extending from the 2020 period through subsequent lows, with a possible third retest projected around late 2026 or early 2027.
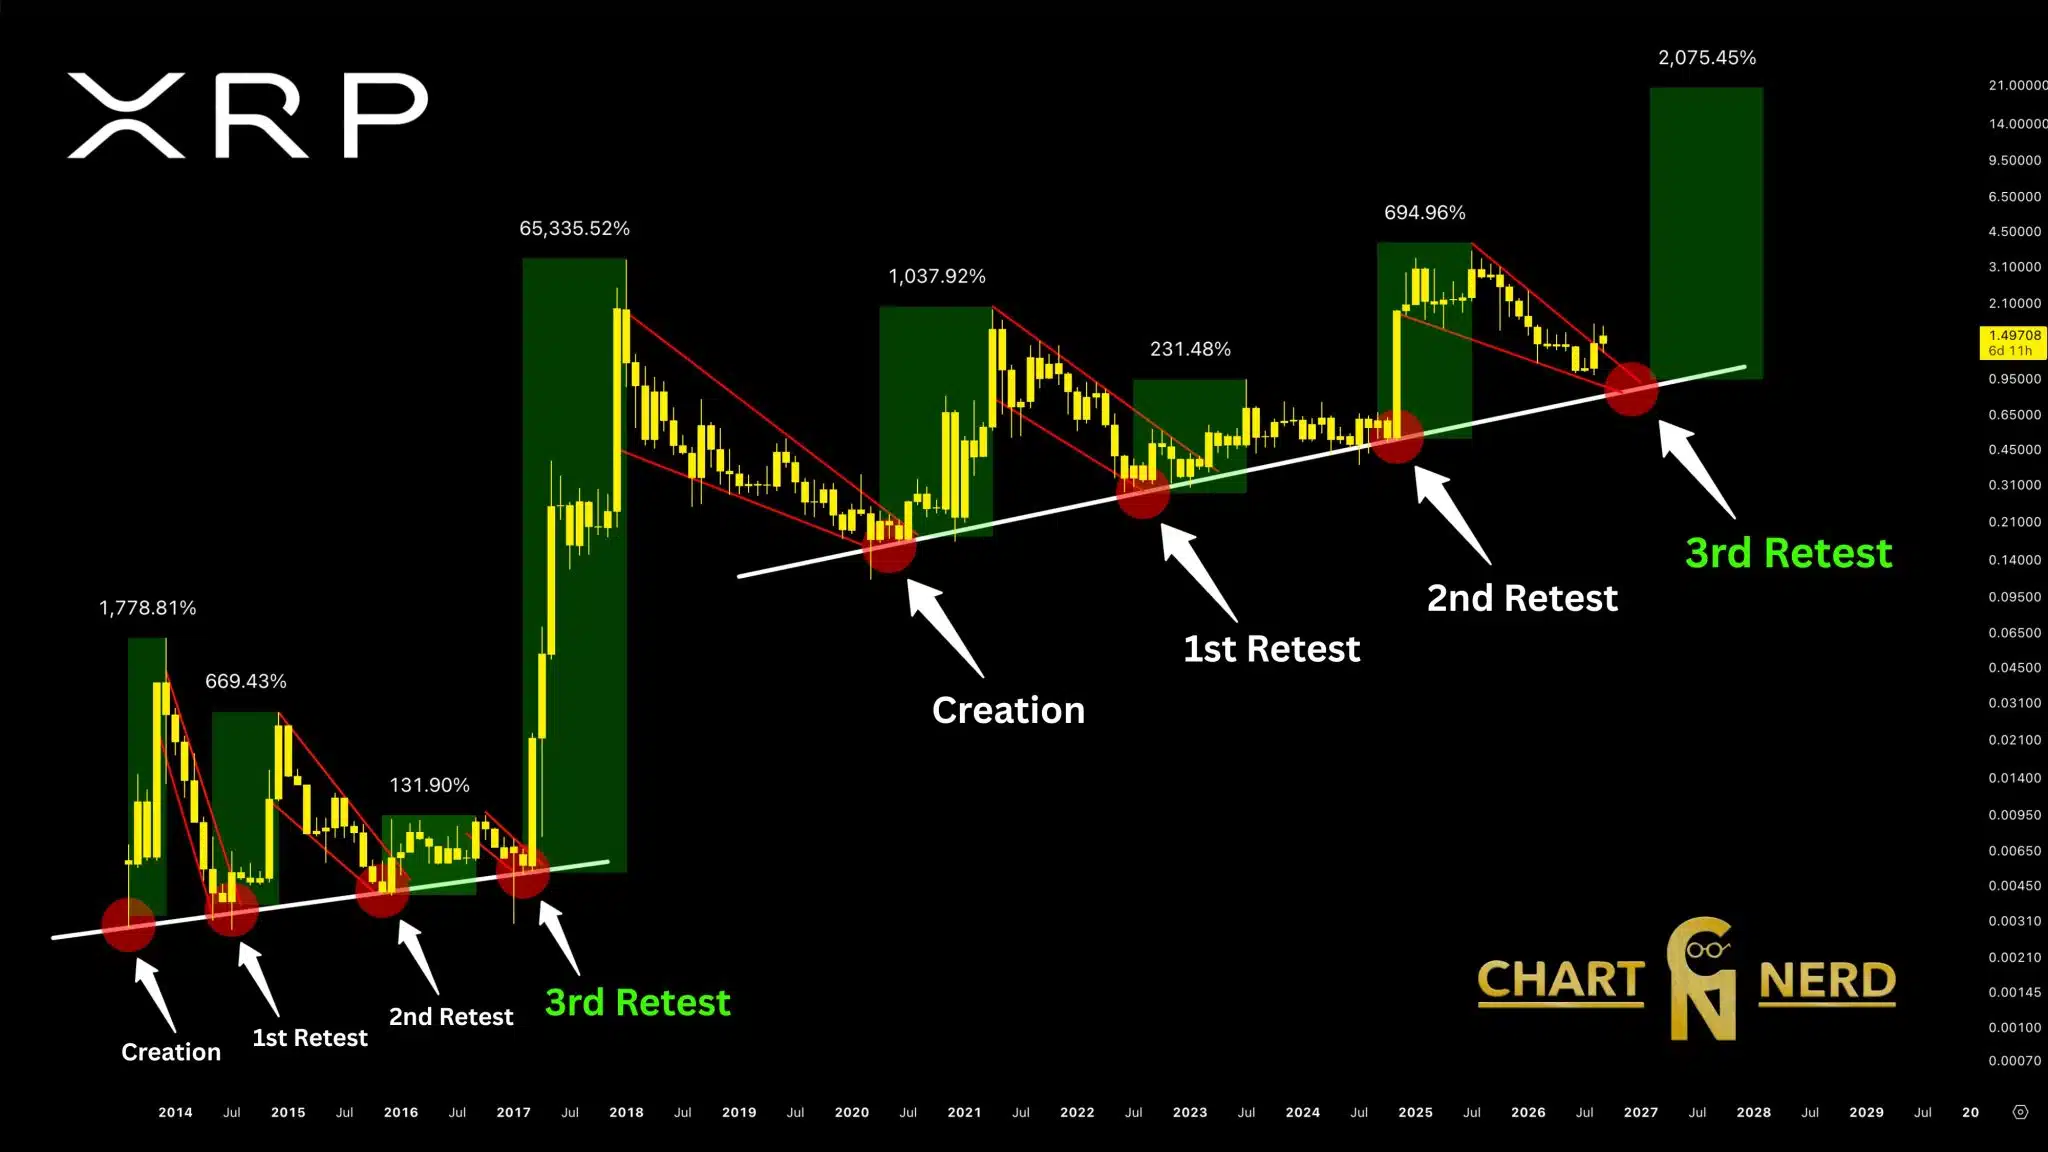
XRP’s Previous and Current Cycles Show a Similar Retest Sequence
The historical comparison tracks a sequence of formation and three support retests. In the earlier cycle, the chart marks advances of 1,778.81%, 669.43%, 131.90%, and 65,335.52% following different stages.
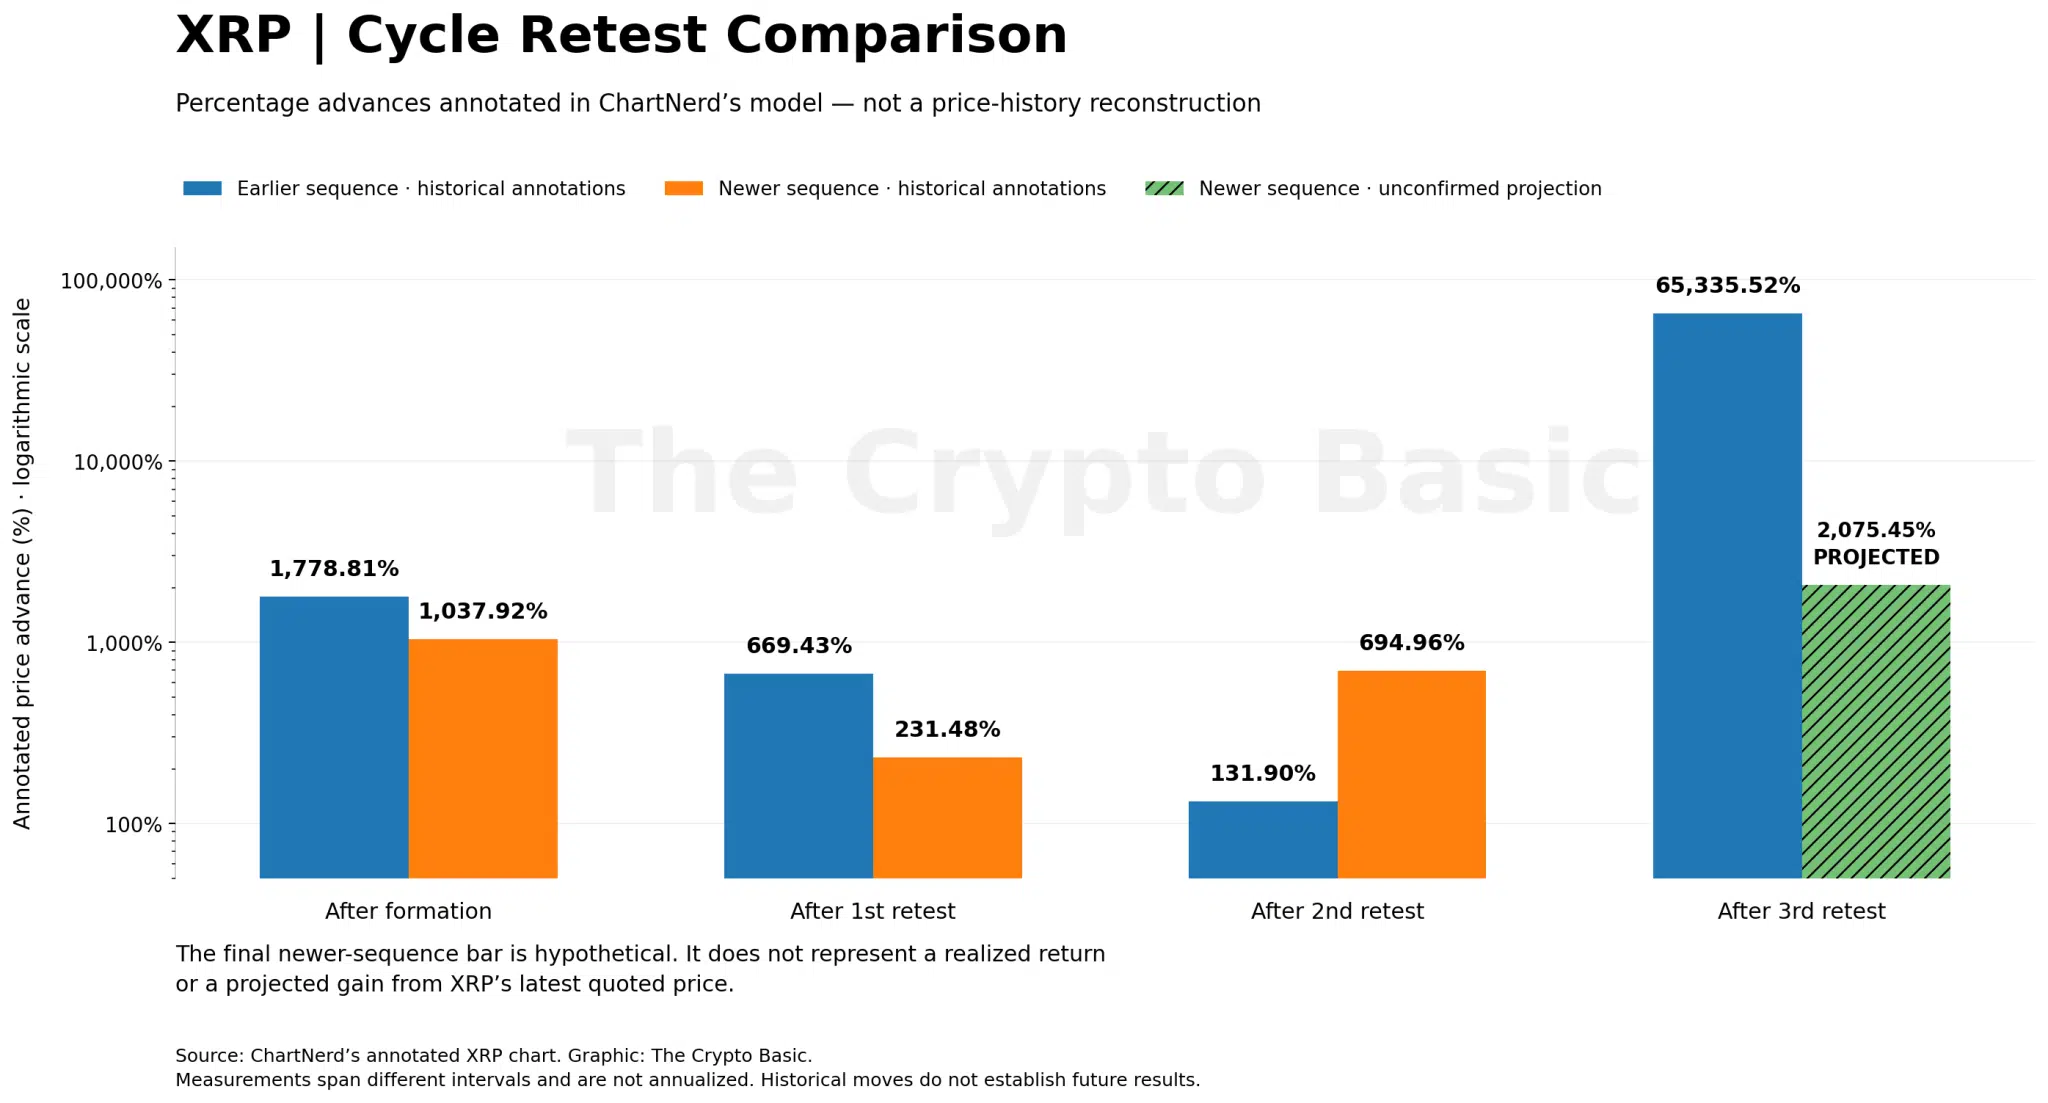
The newer structure records advances of 1,037.92%, 231.48%, and 694.96% following its first three measured stages.
A final 2,075.45% expansion is projected after a potential third retest. These percentages cover different intervals and do not represent annualized or directly comparable returns.
XRP 2,075% Projection Starts Near $0.95
The projected 2,075.45% move does not begin from XRP’s approximately $1.50 price shown on the chart. Its starting point is near a prospective support area around $0.95.
A 2,075.45% increase equals approximately 21.75 times the starting value, placing the resulting level near $20.67. From the chart’s $1.49708 price marker, reaching $20.67 would instead represent an increase of roughly 1,280%.
Third XRP Support Retest Has Not Occurred Yet
The latest candles and the projected third retest represent separate stages. XRP has recently moved above the descending resistance boundary drawn across its latest correction.
However, the model’s third retest is positioned later and lower, near the intersection between descending resistance and the long-term rising support line. The projected expansion extends into 2027–2028, making 2026 primarily the setup period within this model.
XRP Chart Maps $20–$21 as Longer-Term Projected Region
The central technical elements remain the rising six-year support structure, the latest descending resistance boundary, and the anticipated third retest.
The chart’s $20–$21 region is the longer-term projected destination following that proposed sequence. It is based on the potential expansion from the lower support area rather than a 2,075% calculation directly from XRP’s current price.