




Injective gains 25% as Bitcoin rebounds above $80,000. October 16 analysis maps support, resistance, and key signals for BTC, ETH, INJ, AERO, and Zcash today.
| Asset | Aggregate USD price | Rolling 24-hour change | Aggregate 24-hour volume | Market-cap rank |
|---|---|---|---|---|
| Bitcoin (BTC) | $81,965 | +1.34% | $34.98 billion | 1 |
| Ethereum (ETH) | $2,435.07 | +3.12% | $15.51 billion | 2 |
| Injective (INJ) | $9.17 | +25.04% | $299.16 million | 84 |
| Aerodrome Finance (AERO) | $0.919539 | +7.53% | $83.37 million | 83 |
| Zcash (ZEC) | $1,204.87 | +9.41% | $1.25 billion | 10 |
Bitcoin Recovers From a Lower Low as Volume Improves
Bitcoin closed October 15 at $82,133.70 on Kraken, up 0.68%, after falling to $79,709. The session undercut the October 8 low at $80,328.60 but recovered above it before the daily close. That leaves a lower intraday low without a confirmed closing breakdown of the earlier support.
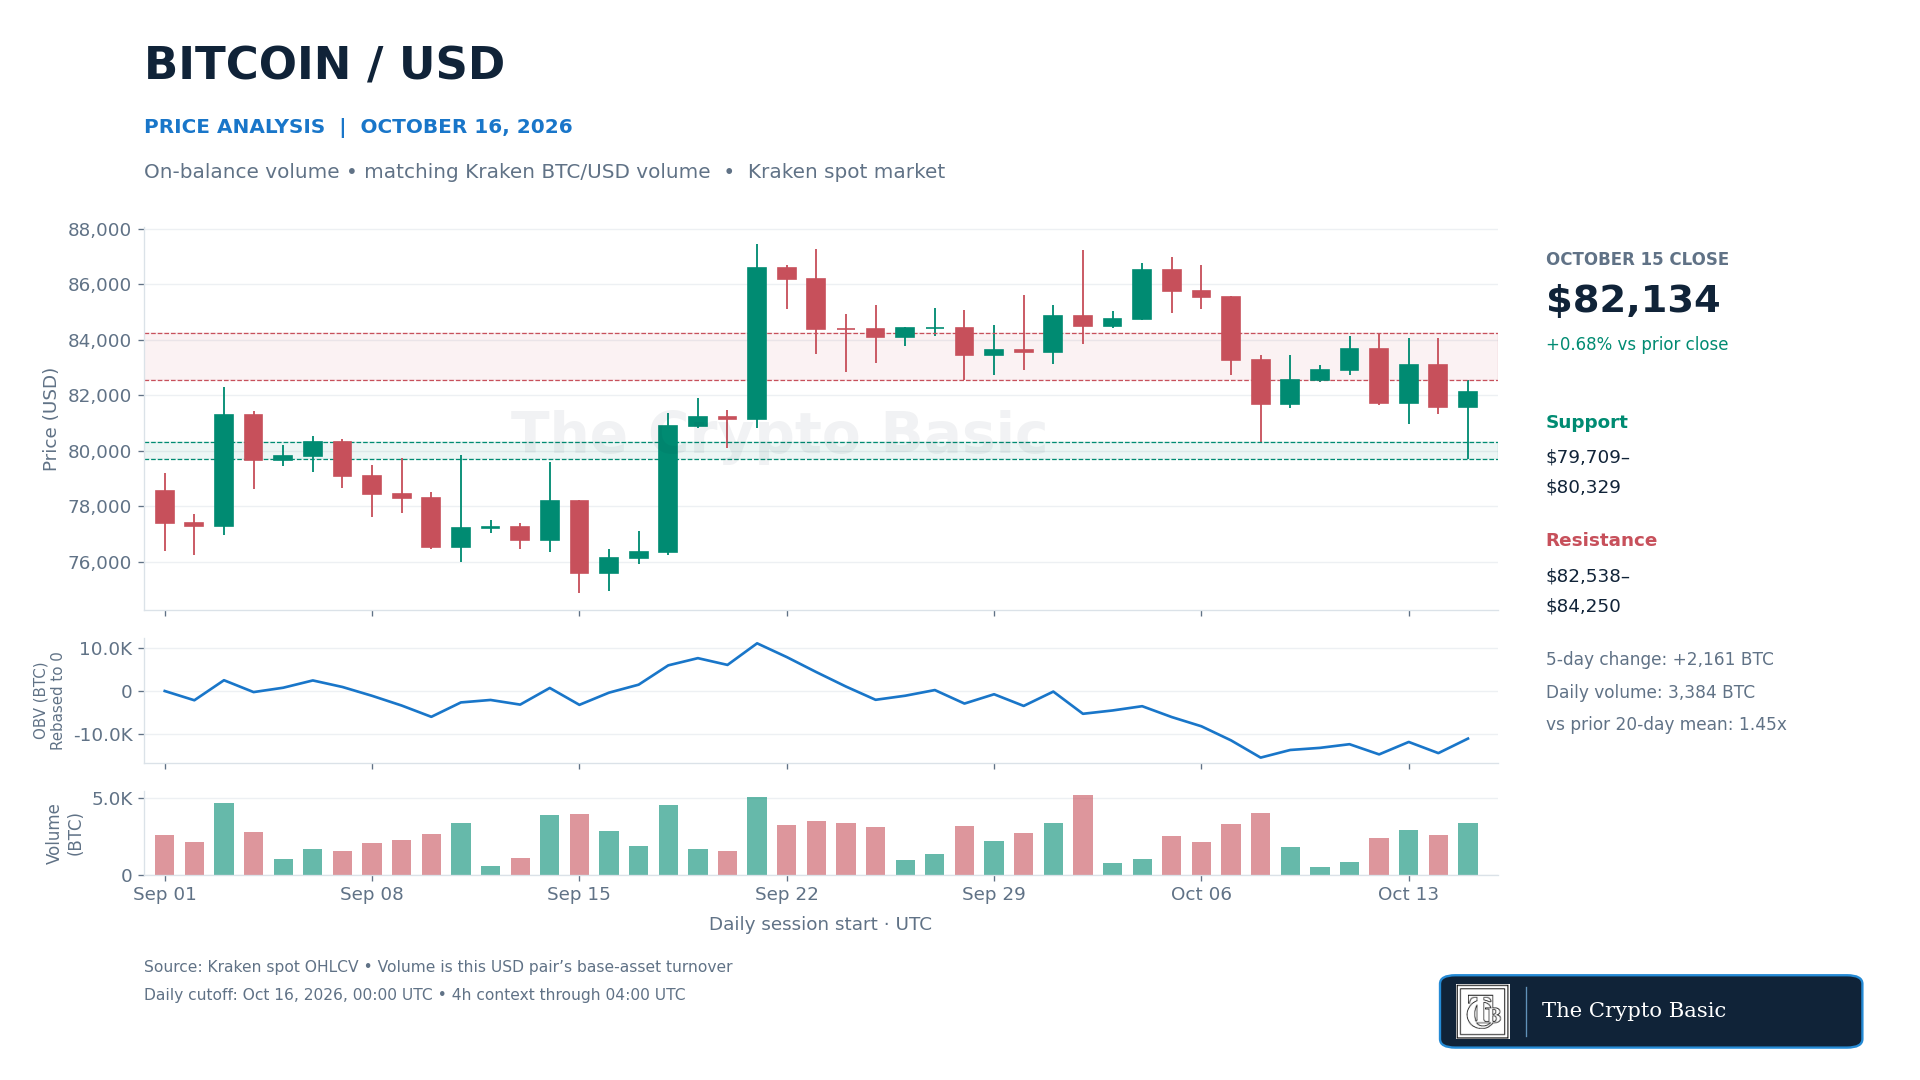
On-balance volume increased by a net 2,161 BTC over five completed sessions. Thursday’s turnover reached 3,384 BTC, approximately 1.45 times the preceding 20-session average.
Those readings show improving short-term participation, although OBV remained below its late-September peak and does not yet confirm a sustained reversal.
The completed 00:00–04:00 UTC candle closed at $82,015.90. CoinGecko’s $81,965 quote was 1.42% above Thursday’s report snapshot of $80,821, a separate comparison from its rolling 24-hour change.
A daily close above $82,538, Thursday’s high, would strengthen the recovery toward $84,049–$84,250. Failure to hold $81,333–$81,576 would bring $80,329 back into focus.
A close below the new $79,709 low would invalidate the rebound and establish a fresh closing breakdown.
Ethereum Remains Below Its 20-Day and 50-Day EMAs
Ethereum closed October 15 at $2,439.39, gaining 0.86% after trading between $2,313.42 and $2,464.54.
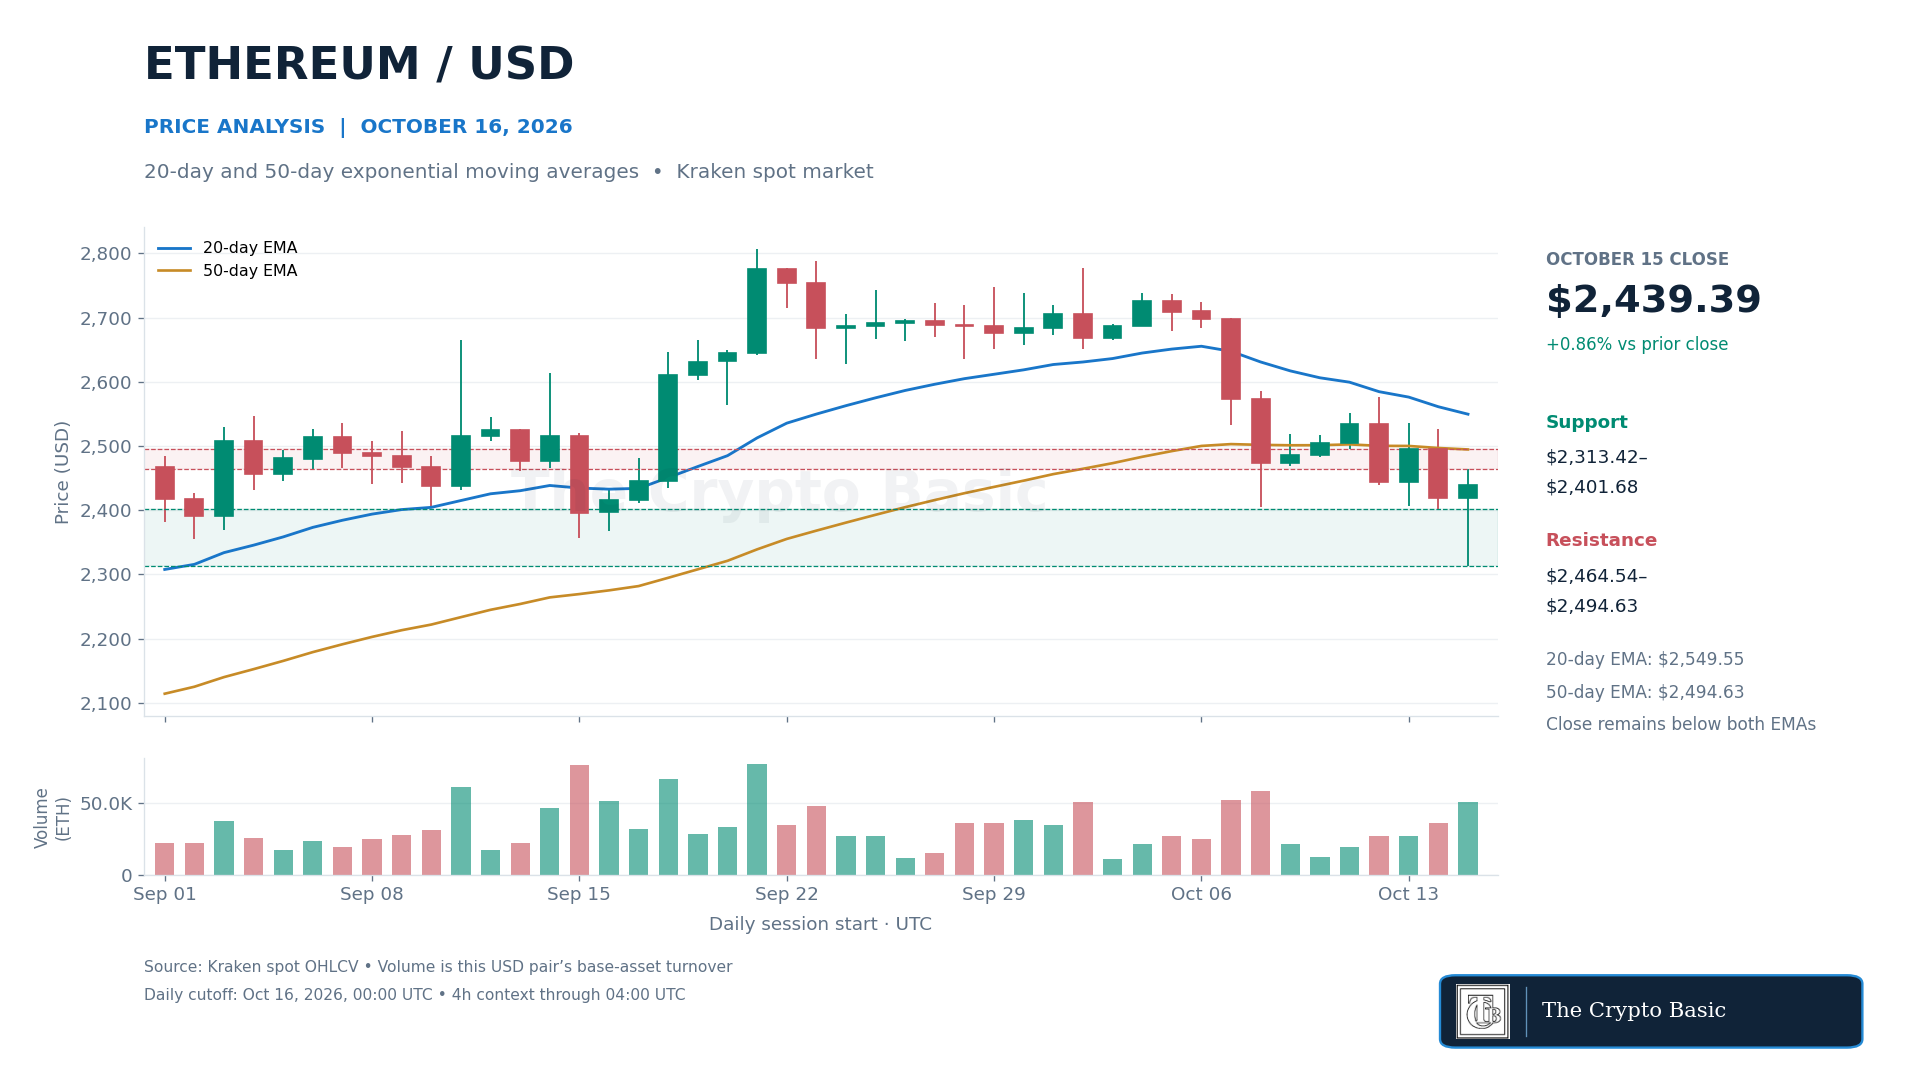
The long lower wick records a recovery from the session low, but price still ended beneath the 50-day exponential moving average at $2,494.63 and the 20-day EMA at $2,549.55.
Both averages declined from their previous readings. The faster average remained above the slower one, so there was no new bearish moving-average crossover. Instead, price remains below two falling daily trend references.
The latest completed four-hour candle closed at $2,436.93. The aggregate quote of $2,435.07 was up over 24 hours but still 3.11% below the $2,513.36 snapshot in the October 14 report.
Initial resistance is $2,464.54, followed by the 50-day EMA near $2,495. A daily close above that average would improve the rebound toward $2,527–$2,550.
Losing $2,401.68 on a daily close would weaken the recovery and refocus attention on $2,313.42. A close beneath that low would invalidate the latest rebound structure.
Injective Confirms a Daily MACD Crossover
Injective closed October 15 at $8.532, advancing 11.41% from $7.658. The candle finished above the previous session’s $8.376 high, while Kraken turnover reached 817,413 INJ, or 3.06 times the preceding 20-session average.
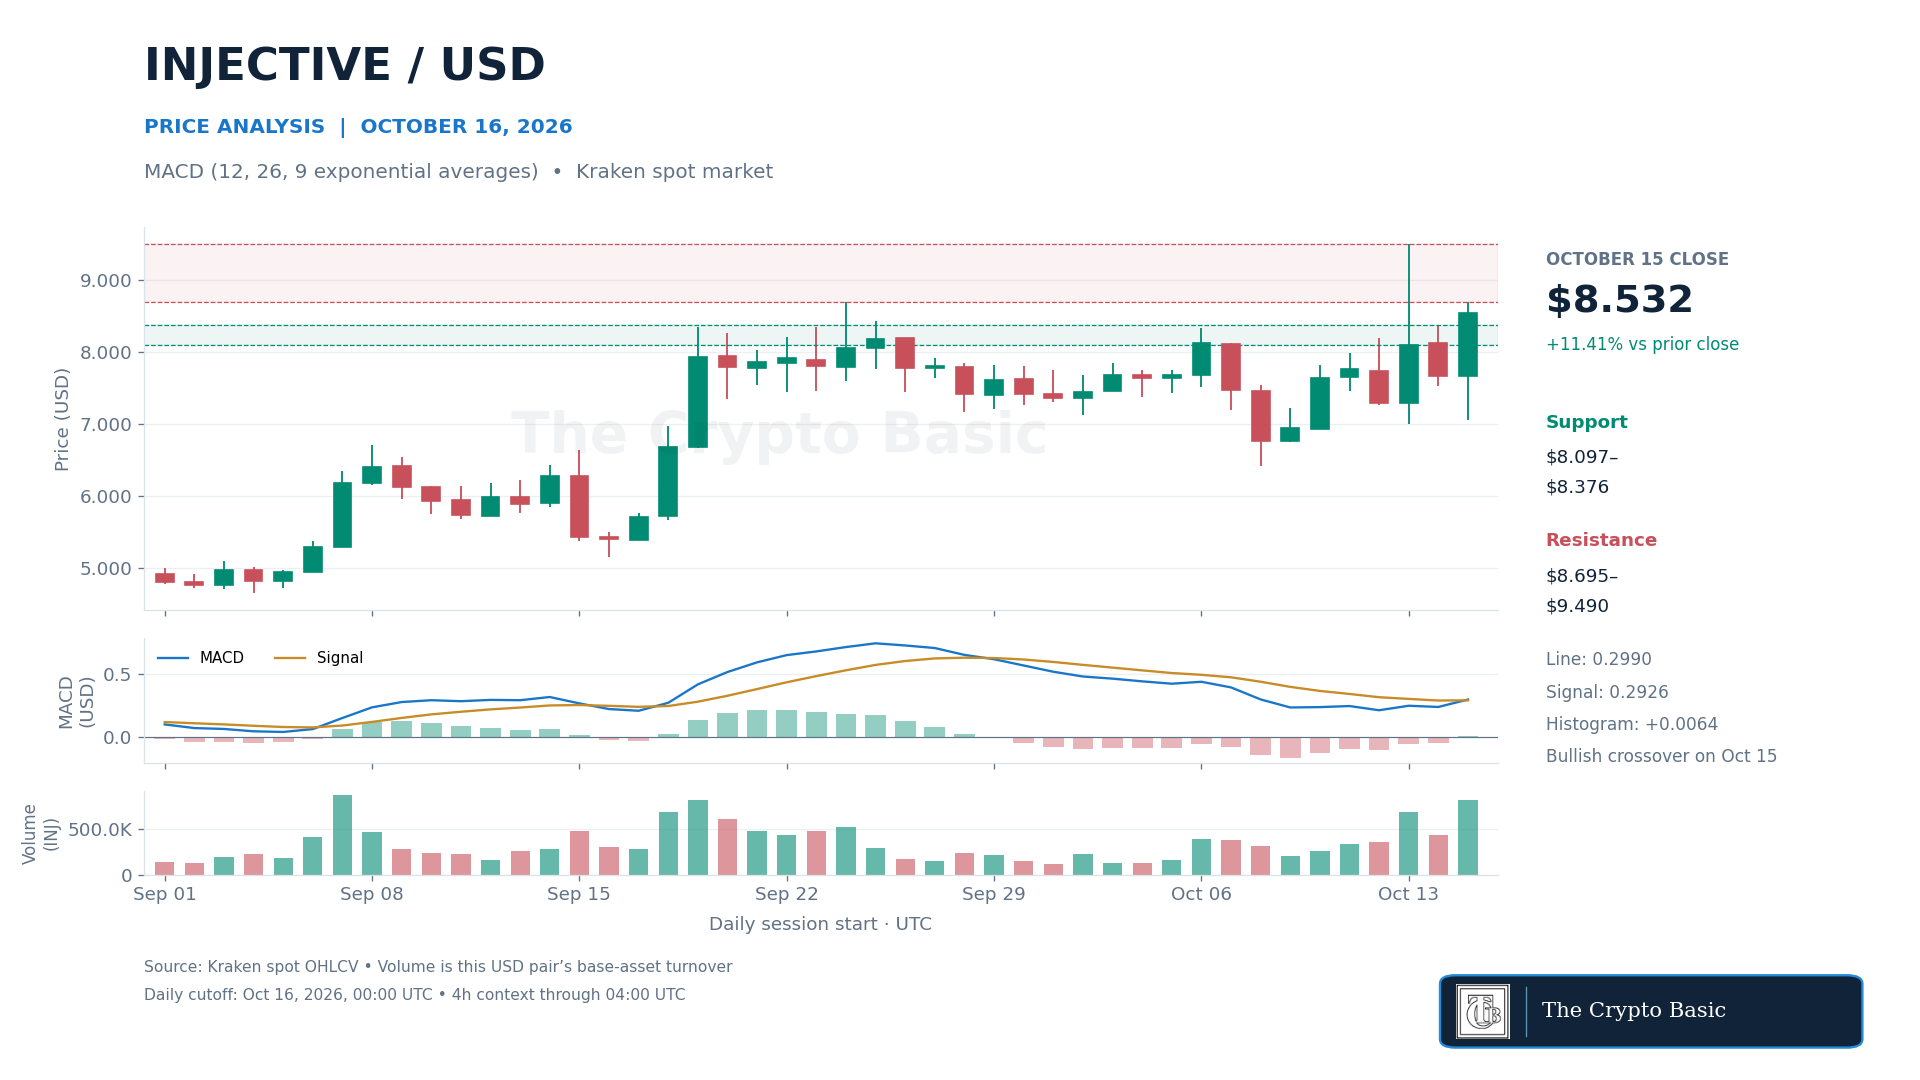
Daily MACD, using 12- and 26-period exponential averages and a nine-period signal EMA, confirmed a bullish line-signal crossover.
The MACD line rose to 0.2990 above its 0.2926 signal. The histogram moved from negative 0.0513 to positive 0.0064. The separation is small, but the crossover occurred on a completed daily candle.
The next completed four-hour candle extended to $9.320 and closed at $9.244. CoinGecko’s $9.17 quote was 11.69% above the $8.21 snapshot in Wednesday’s report.
It also exceeded Wednesday’s $8.764 Fibonacci reference intraday, although a daily close above that level remains unconfirmed.
A daily close above $8.695 would clear Thursday’s high and strengthen the approach to the October 13 peak at $9.490. Holding $8.097–$8.376 would preserve the immediate recovery.
A close below $8.097 would weaken it and expose $7.658; losing $7.057 would invalidate Thursday’s rebound. The MACD crossover alone does not confirm a breakout above $9.490.
Aerodrome RSI Strengthens Below Recent Resistance
Aerodrome closed October 15 at $0.9365, up 4.09%, after recovering from $0.8300. The close remained below the $0.9413 session high and the October 10 high at $0.9599, leaving a nearby resistance zone intact.
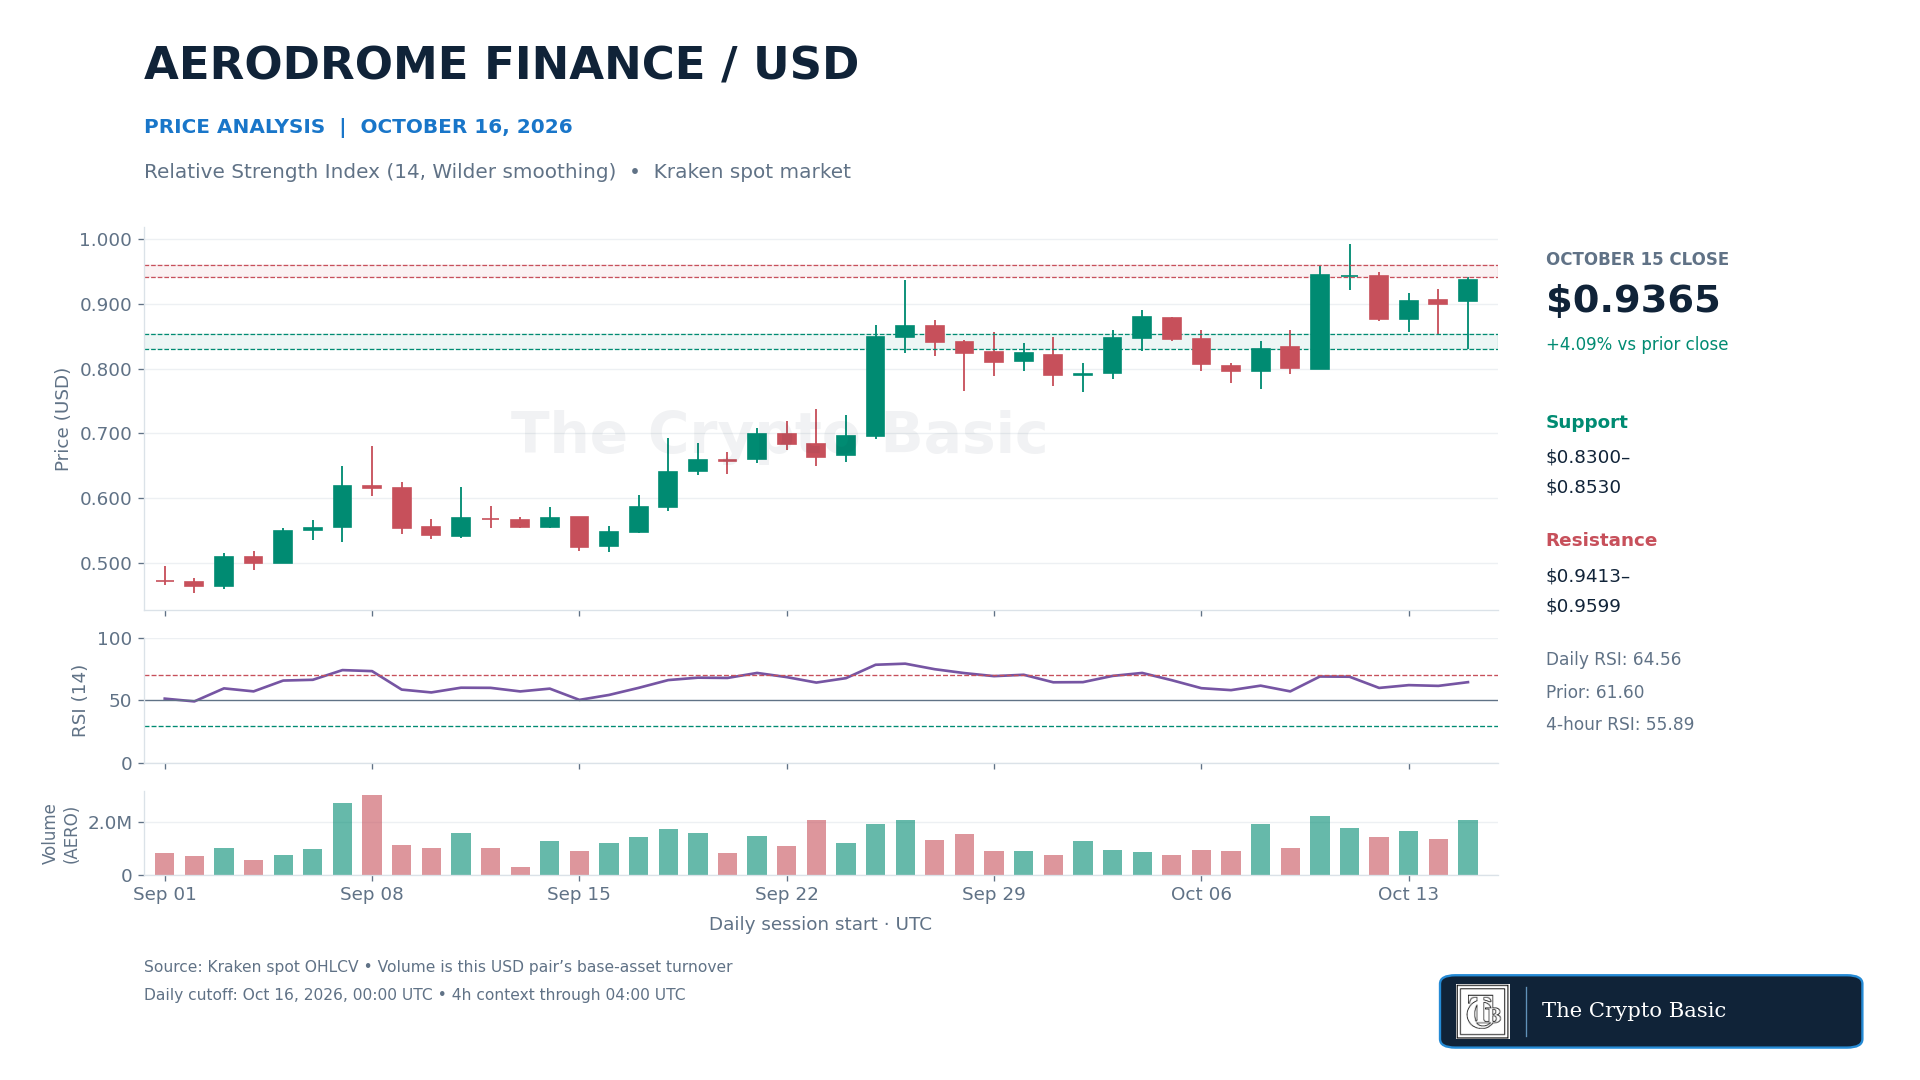
The 14-day RSI, using Wilder smoothing, rose to 64.56 from 61.60. Momentum strengthened while remaining below the conventional 70 overbought threshold.
This supports the recovery but does not establish that resistance has been cleared.
The subsequent four-hour candle pulled back to $0.9205 at its close, with four-hour RSI at 55.89. CoinGecko’s $0.919539 quote likewise sat below the completed daily close, despite its positive rolling 24-hour performance.
A daily close above $0.9413–$0.9599 would strengthen the case for a test of the October 11 high at $0.9919.
The first support references are the recent $0.8997–$0.9043 closes, followed by $0.8530–$0.8568. Losing $0.8300 on a daily close would invalidate Thursday’s recovery and reopen the $0.7916–$0.7996 area.
Caption: AERO/USD daily RSI (14) rises to 64.56 as price approaches $0.9413–$0.9599 resistance following a rebound from $0.8300.
Zcash Retests the Midpoint of Its Latest Decline
Zcash closed October 15 at $1,220.32, gaining 6.46% after touching $1,073.55. The recovery followed a decline from the October 12 swing high at $1,348.03.
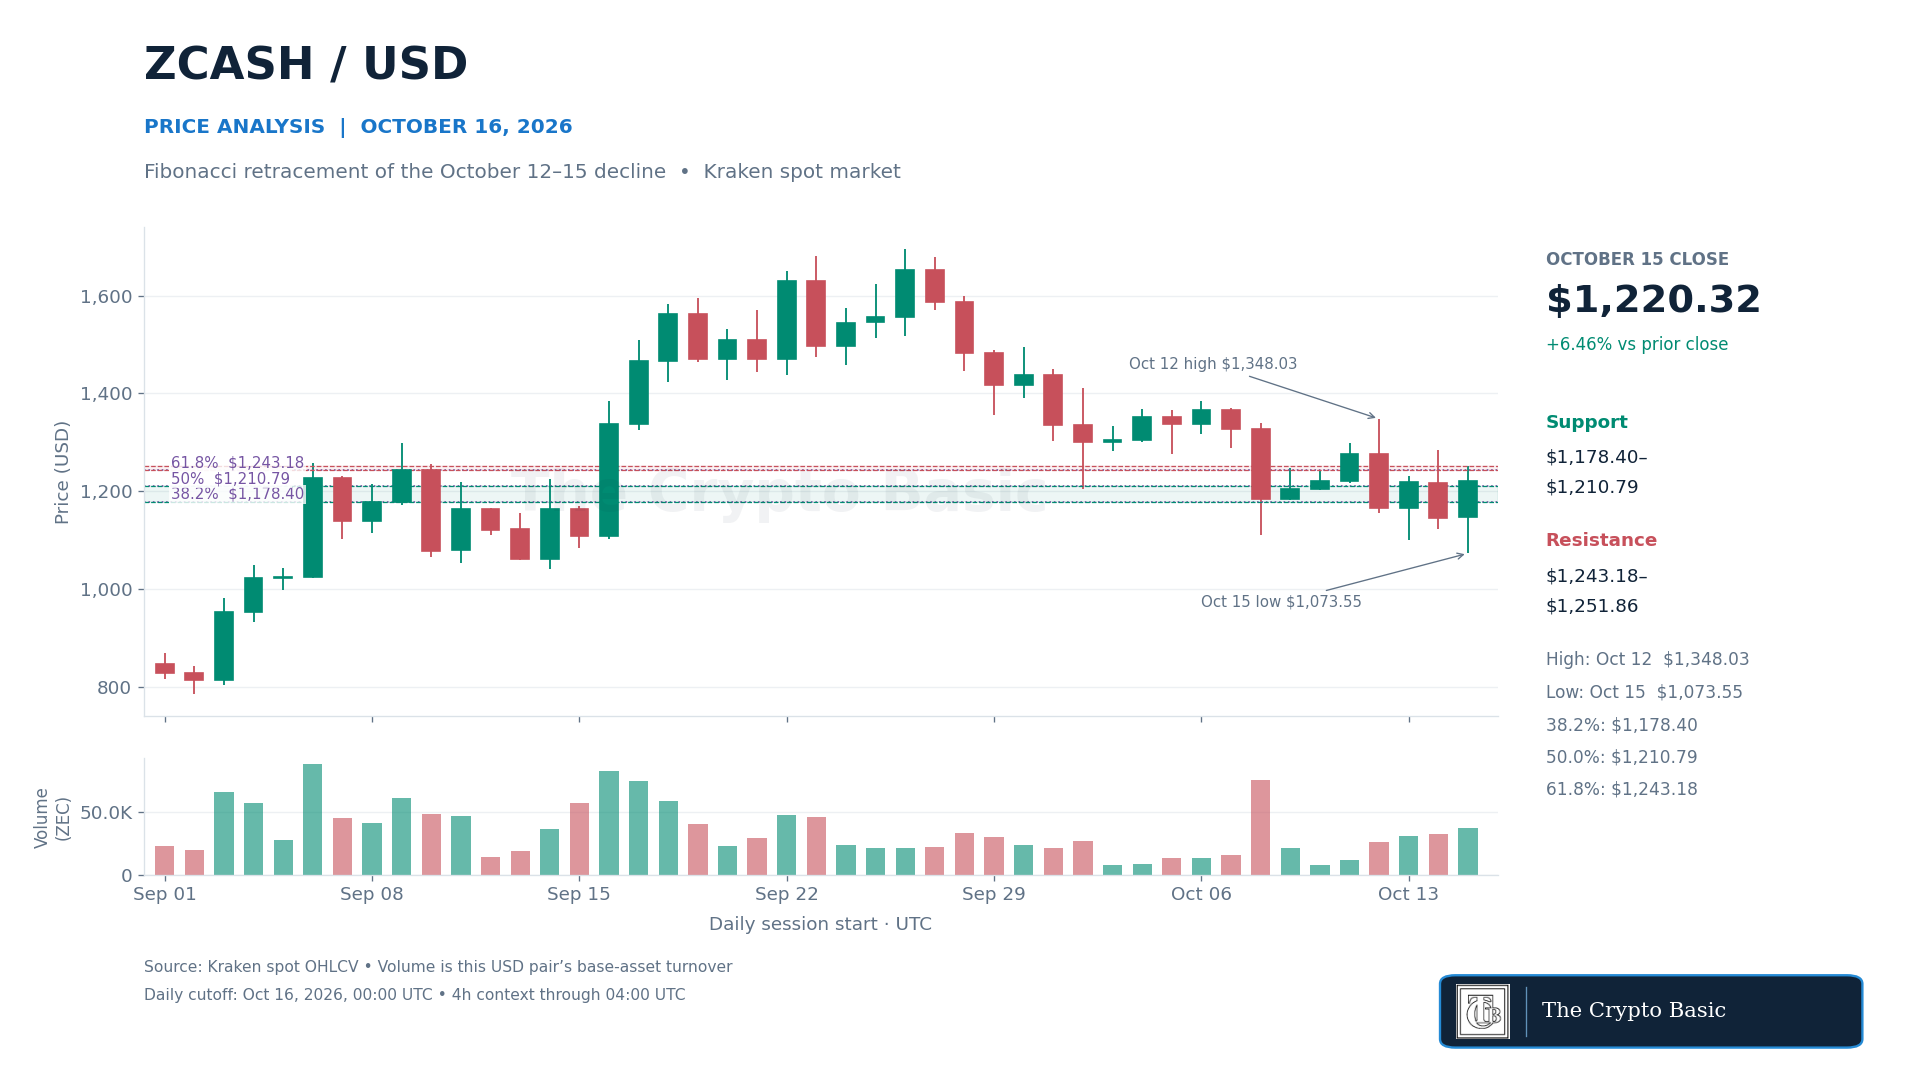
Fibonacci retracements measure an upward recovery of that specific $1,348.03-to-$1,073.55 downswing.
The 38.2% level is $1,178.40, the 50% midpoint is $1,210.79 and the 61.8% level is $1,243.18. Thursday’s daily close reclaimed the midpoint but ended below 61.8%.
The completed four-hour candle subsequently closed at $1,208.26, while the aggregate quote was $1,204.87. Both were back below the midpoint, making the initial recovery less secure.
This was a short-term loss of the reference level rather than a completed daily failure.
A daily close above $1,243.18–$1,251.86 would clear the 61.8% retracement and Thursday’s high, opening $1,284.78–$1,289.29, where the prior session high meets the 78.6% retracement.
A close below $1,178.40 would weaken the rebound toward $1,123.59 and $1,100.01. A new low below $1,073.55 would invalidate these recovery anchors and require the retracement to be recalculated.