




PUMP falls 14% as Bitcoin, XRP, ONDO and QNT test support. Daily charts map key levels, risks, and technical signals across five major crypto assets today.
| Asset | Price | 24-hour change | Aggregate 24-hour volume | Rank |
|---|---|---|---|---|
| Bitcoin | $80,821 | -3.45% | $38.57B | 1 |
| XRP | $1.30 | -4.92% | $2.25B | 5 |
| Ondo | $0.431072 | -8.19% | $217.31M | 48 |
| Quant | $195.20 | -9.34% | $125.65M | 39 |
| Pump.fun | $0.004352 | -13.66% | $244.31M | 49 |
Bitcoin RSI Weakens as Price Retests $80,300
Bitcoin’s completed October 14 candle fell 1.83% to $81,576 after trading between $81,333 and $84,049. Its 14-day RSI, calculated with Wilder smoothing, dropped to 46.62 from 51.89.
The move below 50 shows weakening momentum without reaching the conventional oversold threshold of 30.
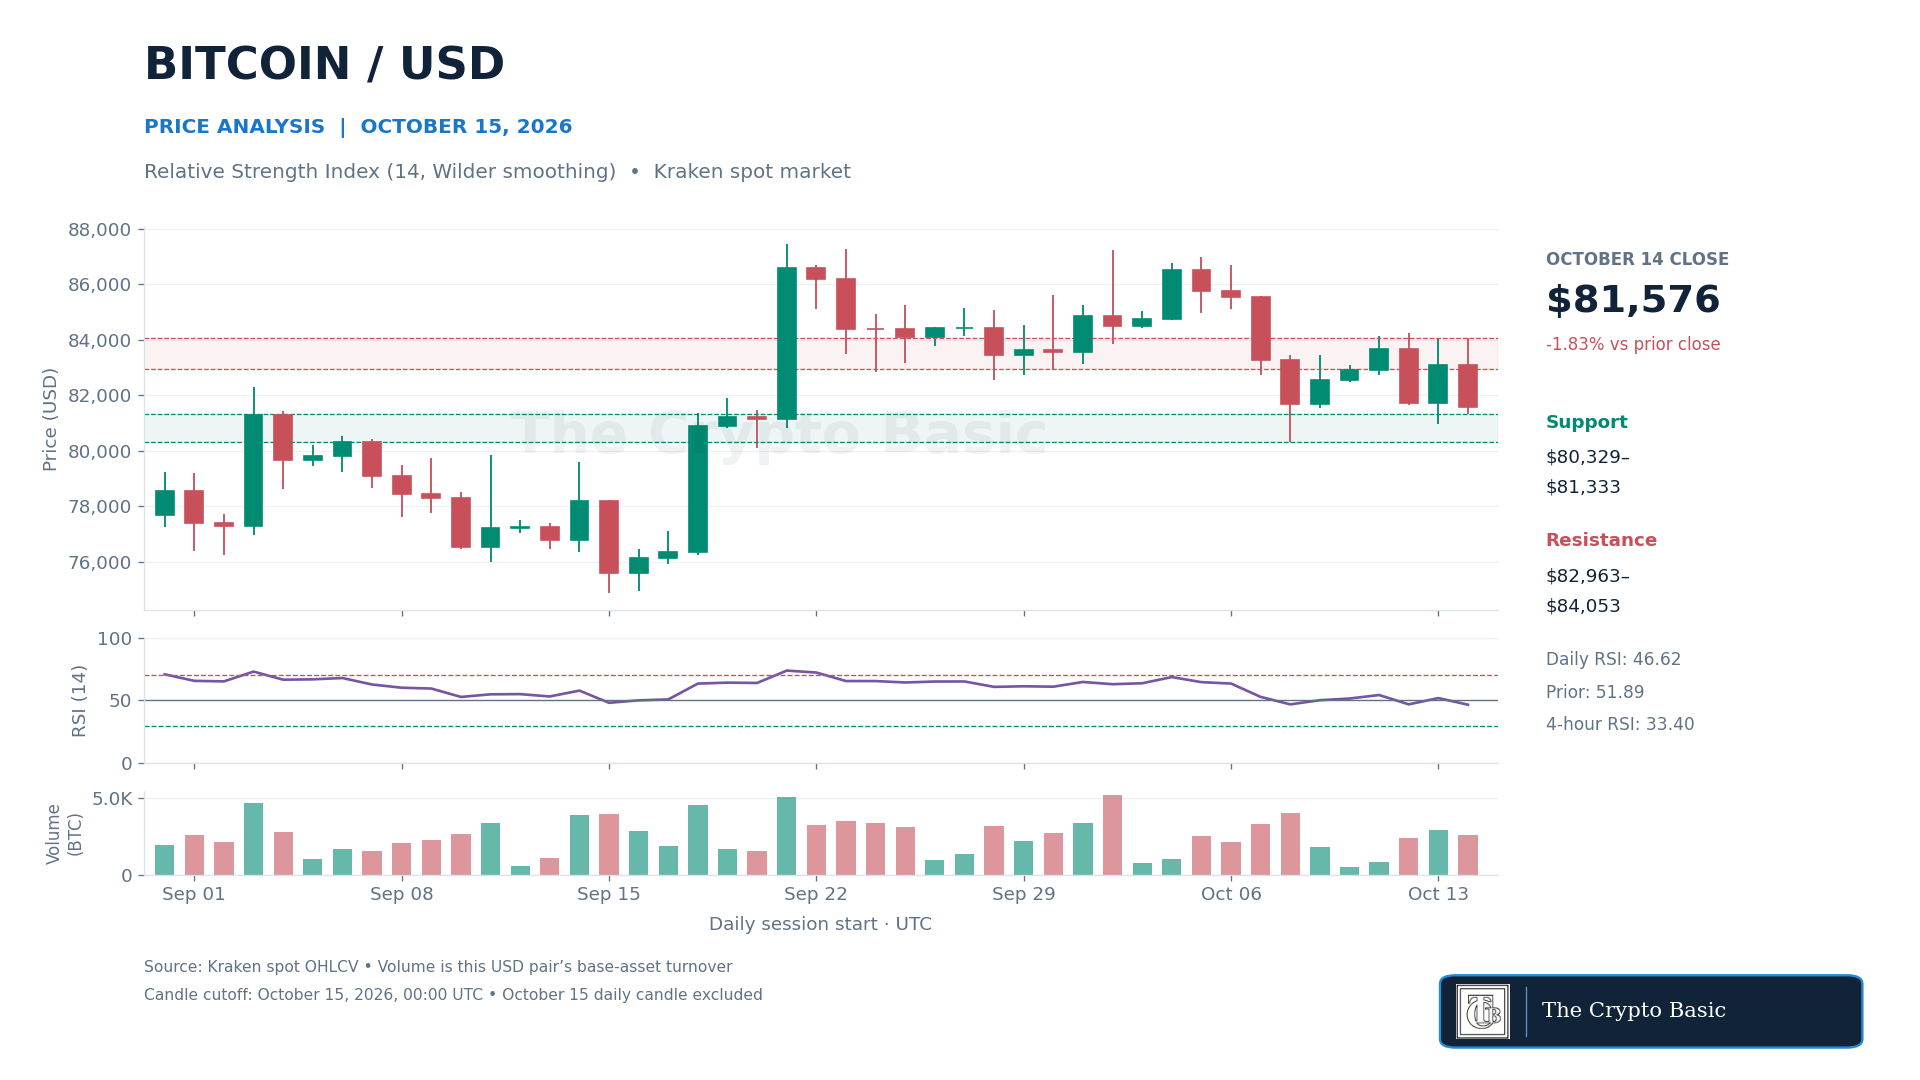
The completed 00:00–04:00 UTC candle closed at $80,828, while four-hour RSI stood at 33.40. The $80,821 market quote remained close to the seven-day low of $80,329, but this intraday test did not establish a confirmed daily breakdown.
A daily close below $80,329–$81,333 would weaken the range and bring the 50-day EMA near $80,257 into focus, followed by the upper-$79,000 area.
Recovering the 20-day EMA at $82,963 would improve the setup, although Bitcoin would still need to close above $84,053–$84,250 to clear its recent ceiling.
XRP Presses the Lower Bollinger Band
XRP ended October 14 at $1.3299, down 2.56%, after setting a daily low of $1.3020. The close held just above the lower Bollinger Band at $1.3211, calculated from a 20-day simple moving average with two population standard deviations. The band midpoint stood at $1.4557.
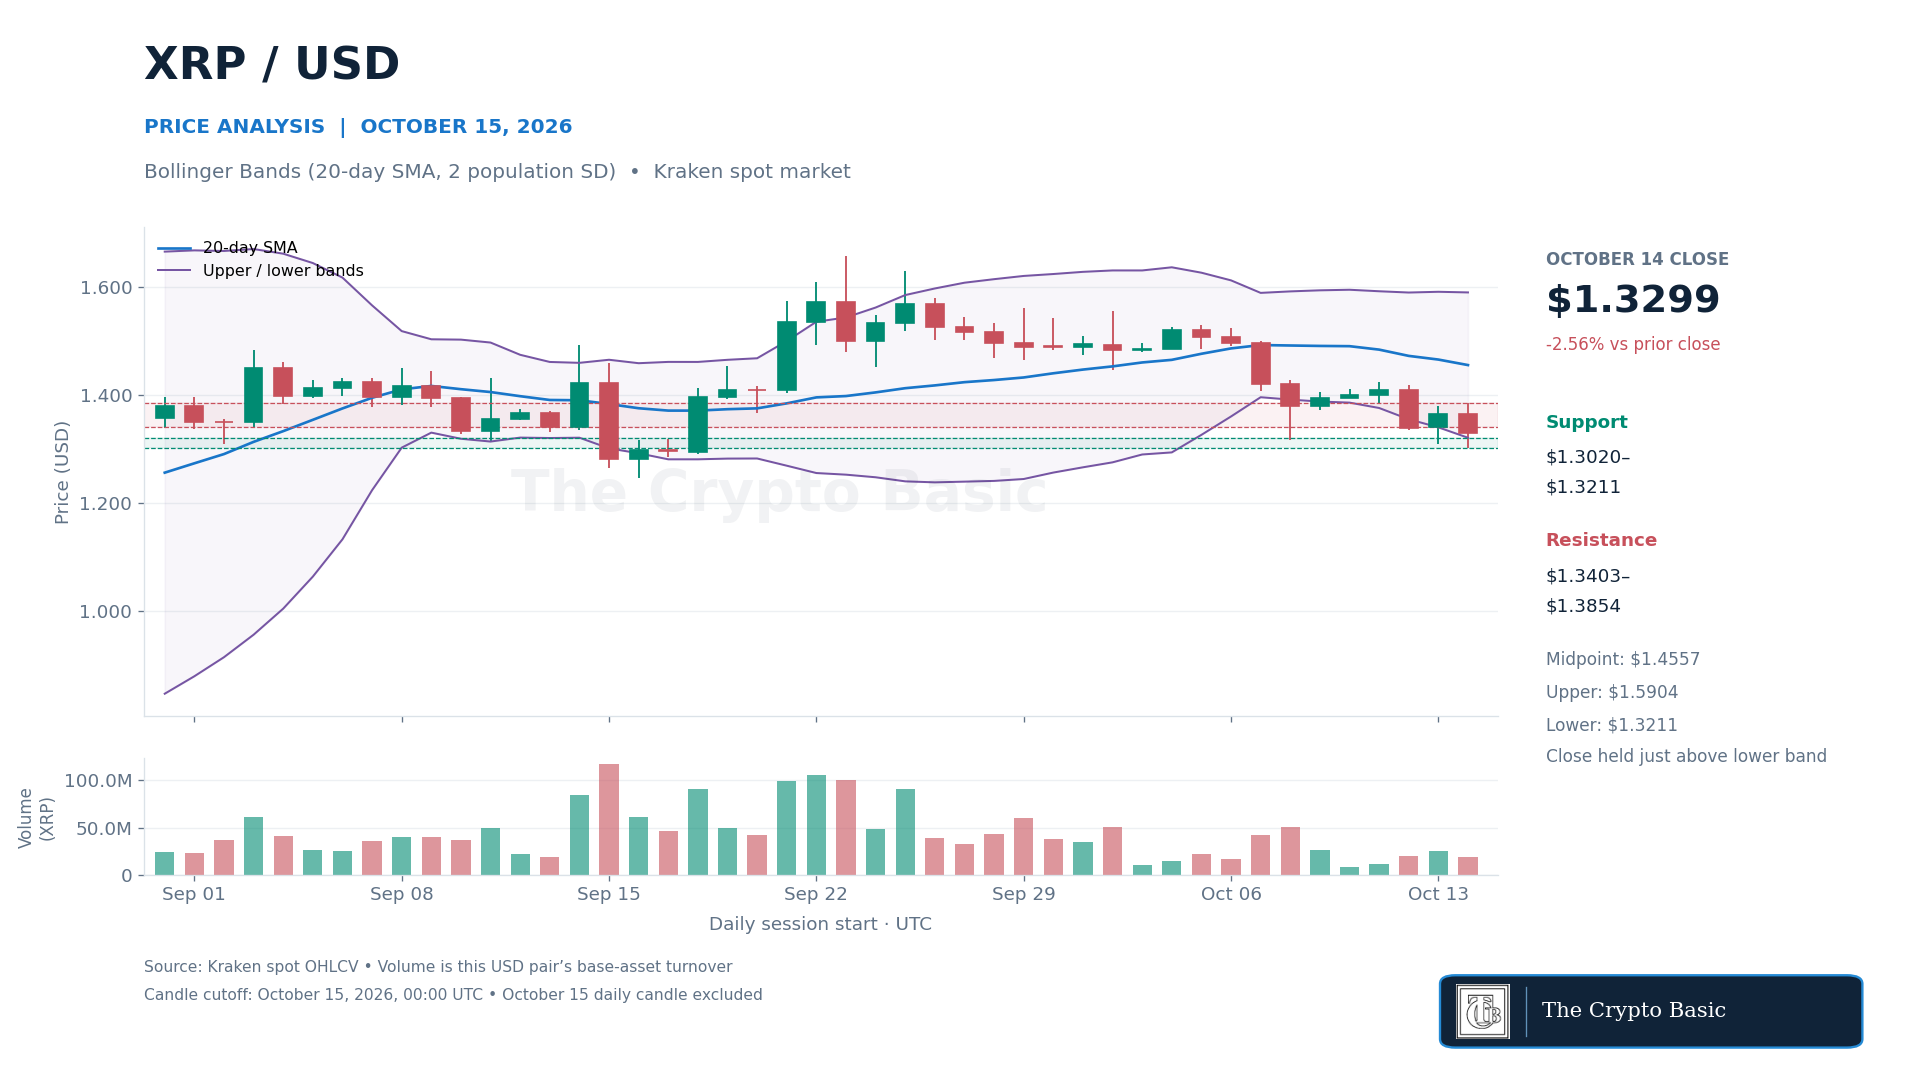
The next completed four-hour candle fell as low as $1.2834 and closed at $1.3024. The $1.30 market price was approximately 5.1% below the roughly $1.37 level cited in Wednesday’s report.
Because the current daily candle remained open, the move below the lower band and previous daily low was not a confirmed closing break.
A daily close below $1.3020 would expose $1.2834 and the September 16 swing low near $1.2461.
Holding the lower-band area and reclaiming $1.3403 would begin to stabilize the structure.
A close above $1.3854 would offer stronger confirmation and reopen a move toward the $1.4557 midpoint.
Ondo Sits Between Its 20-Day and 50-Day EMAs
Ondo was the highest-ranked eligible non-core asset on CoinGecko’s search-trending list at the cutoff. It traded at $0.431072, down 8.19% over 24 hours, with a market-cap rank of 48.
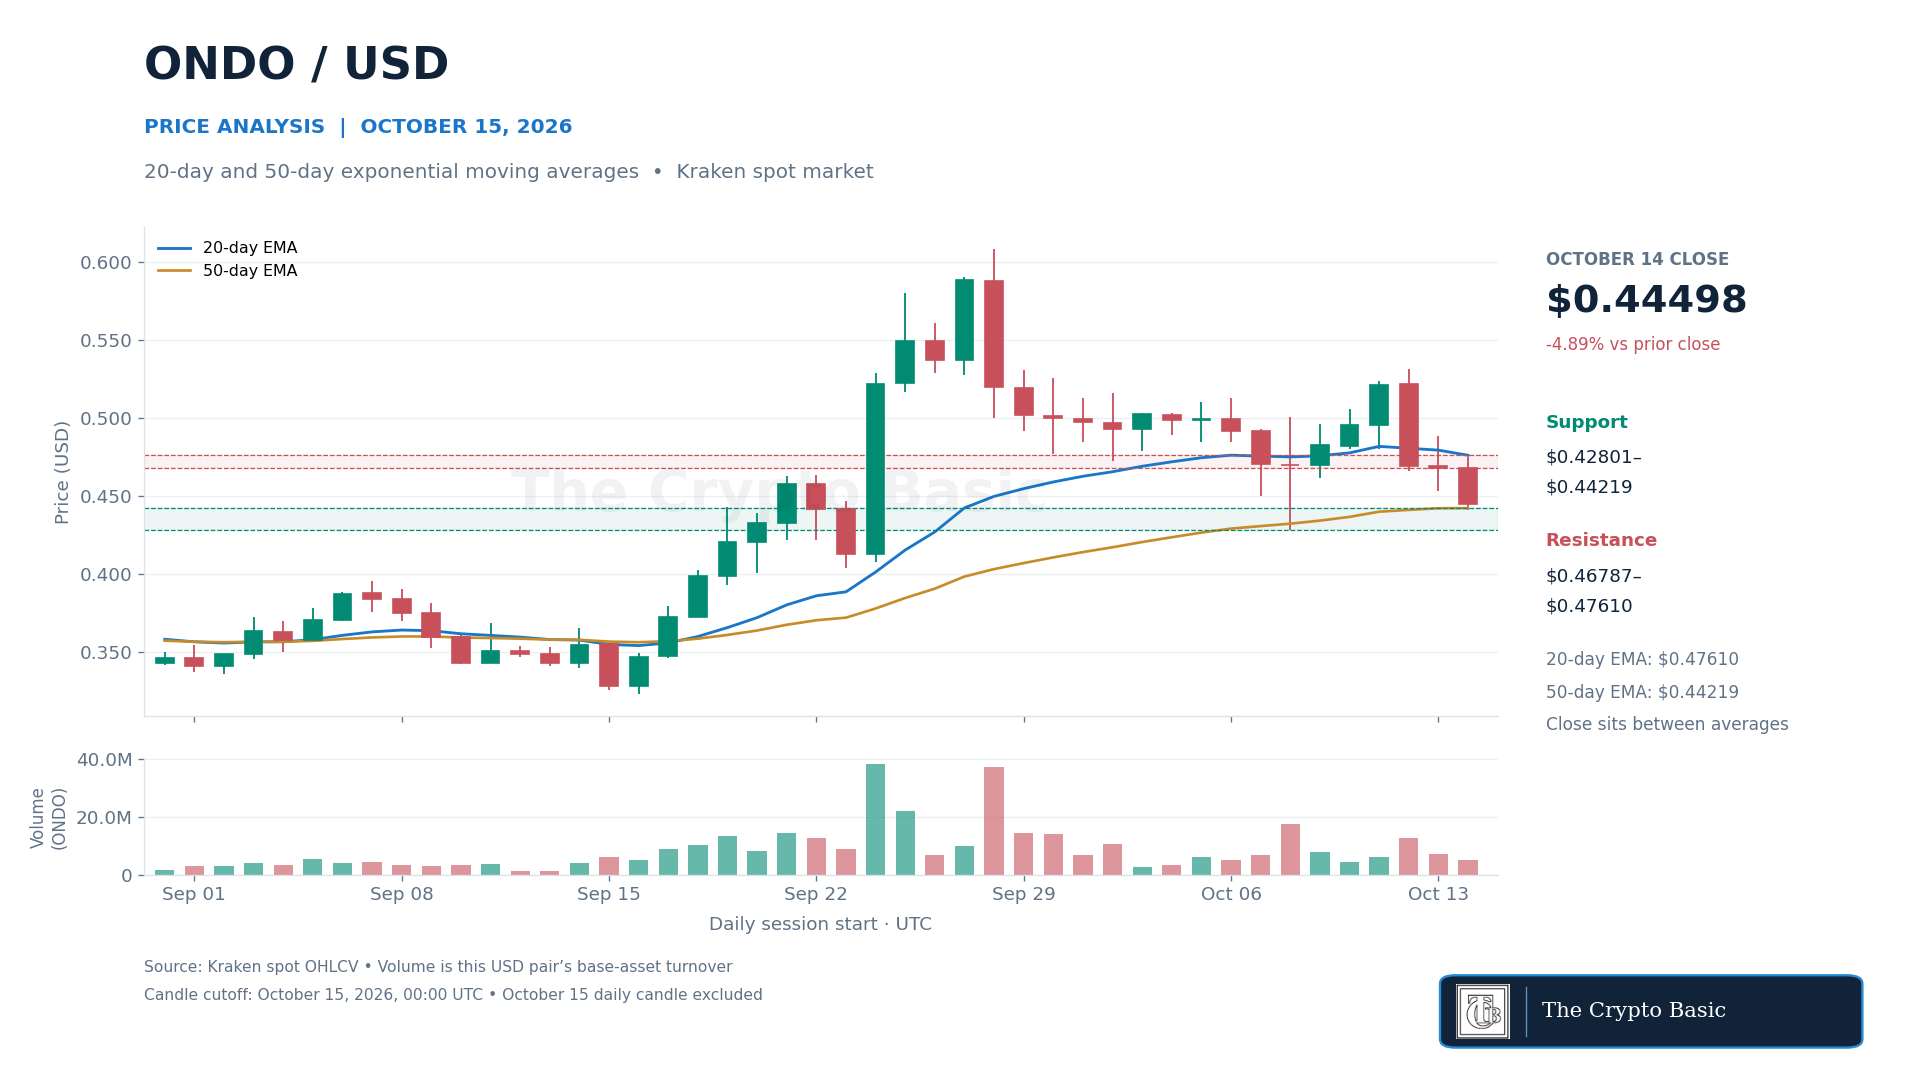
ONDO’s completed daily candle lost 4.89% to $0.44498. This left price below the 20-day EMA at $0.47610 but marginally above the 50-day EMA at $0.44219.
Its position between the averages describes a compressed decision area rather than a confirmed directional break.
The completed four-hour candle was weaker, closing at $0.42990 after touching $0.42255.
A daily close below $0.42801–$0.44219 would validate the deterioration and place $0.42255, followed by approximately $0.41 and $0.40, at risk.
For a bullish shift, ONDO must recover $0.46787 and close above the 20-day EMA at $0.47610. That would expose $0.48838 and the psychological $0.50 level.
Quant’s Wide ATR Calls for Closing Confirmation
Quant ranked 39th by market capitalization and appeared among CoinGecko’s most-searched assets as its 24-hour loss reached 9.34%.
Its completed October 14 candle closed at $205, down 2.32%, before the next four-hour candle fell to $190.44 and closed at $194.51.
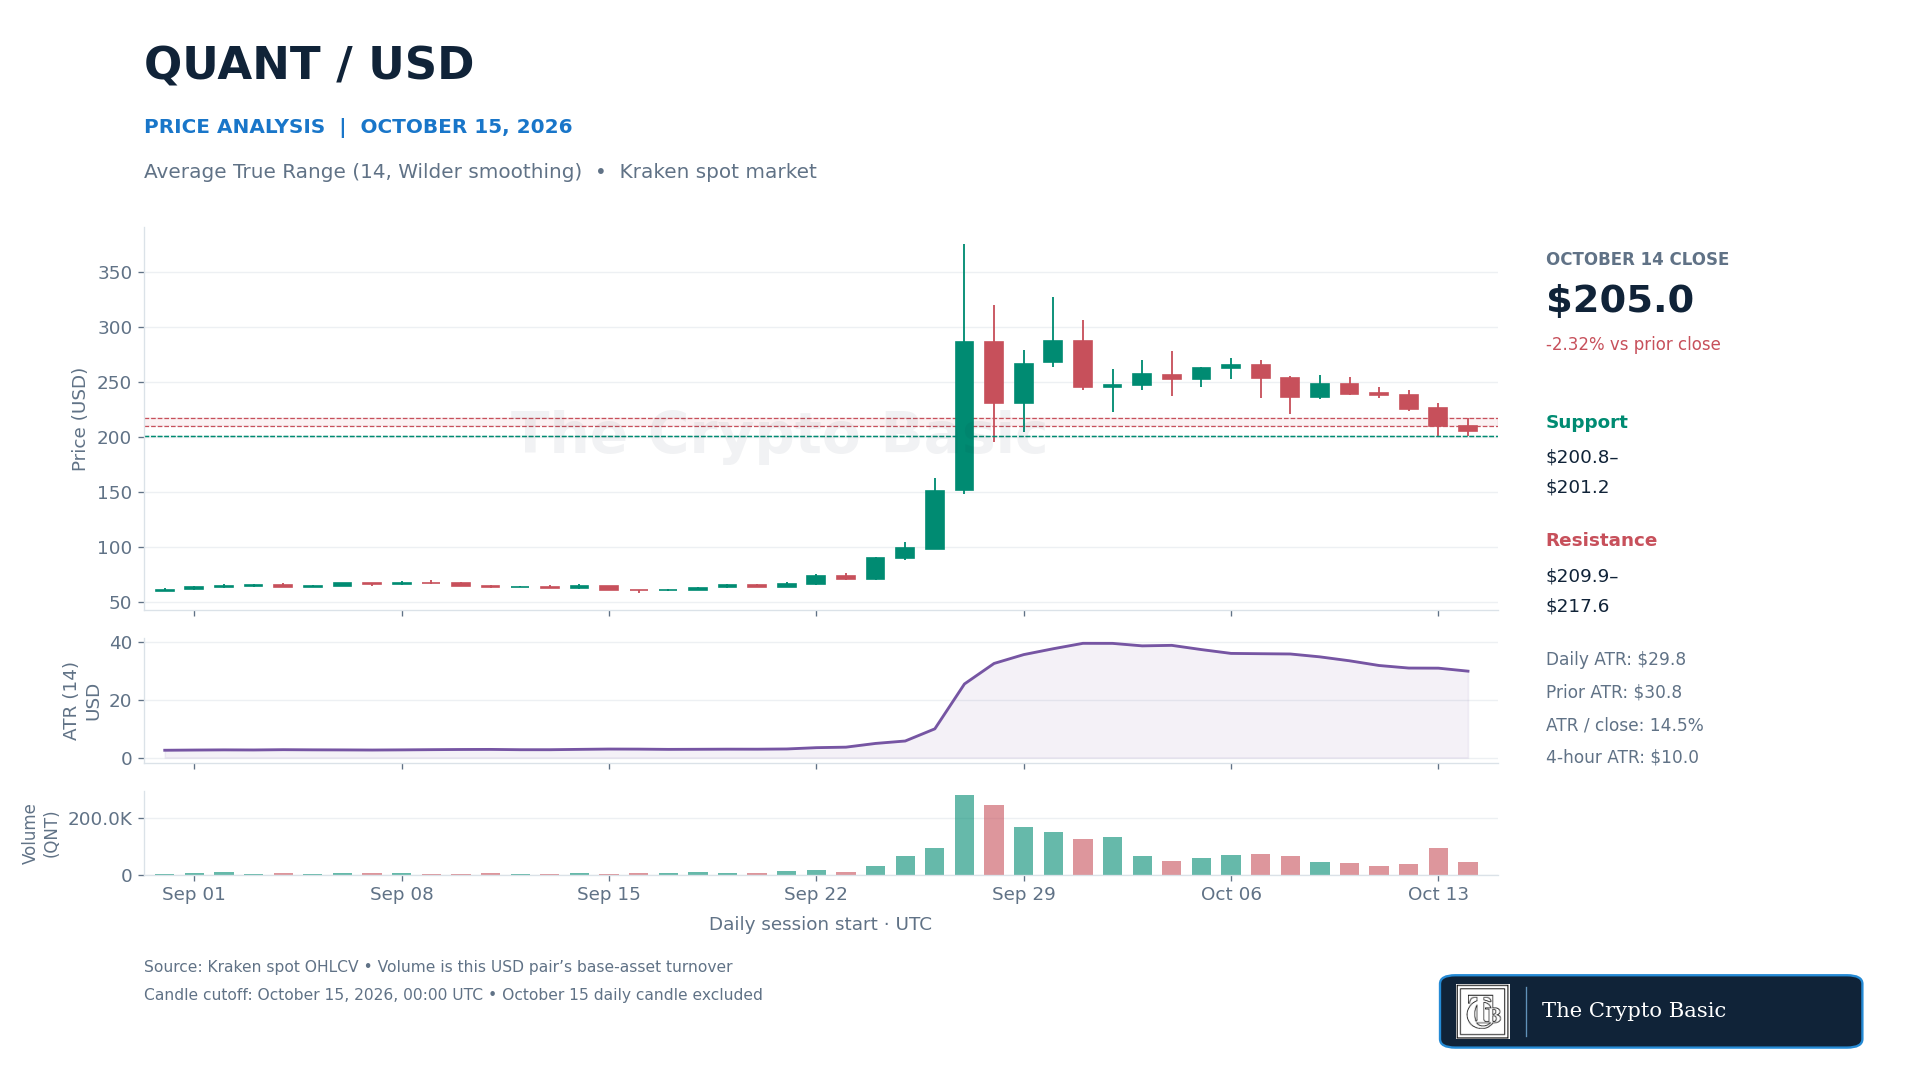
QNT’s 14-day average true range, using Wilder smoothing, measured $29.80, or 14.53% of the daily close. ATR gauges movement size rather than direction.
The reading eased from $30.83 but remained large enough for intraday wicks to cross nearby levels without confirming a trend change.
The $195.20 live quote was below completed daily support at $200.79–$201.20. A daily close below that zone would confirm a break and put $190.44 in view, followed by the four-hour 200-period EMA near $183.66.
A recovery through $209.87 would ease immediate pressure, while a close above $217.55 would clear the October 14 high and shift attention to $231.15.
PUMP MACD Deteriorates as Weekly Loss Reaches 30%
PUMP recorded the largest 24-hour decline among the five assets, falling 13.66% to $0.004352. It remained a top-100 asset at rank 49 and was down 30.29% over seven days.
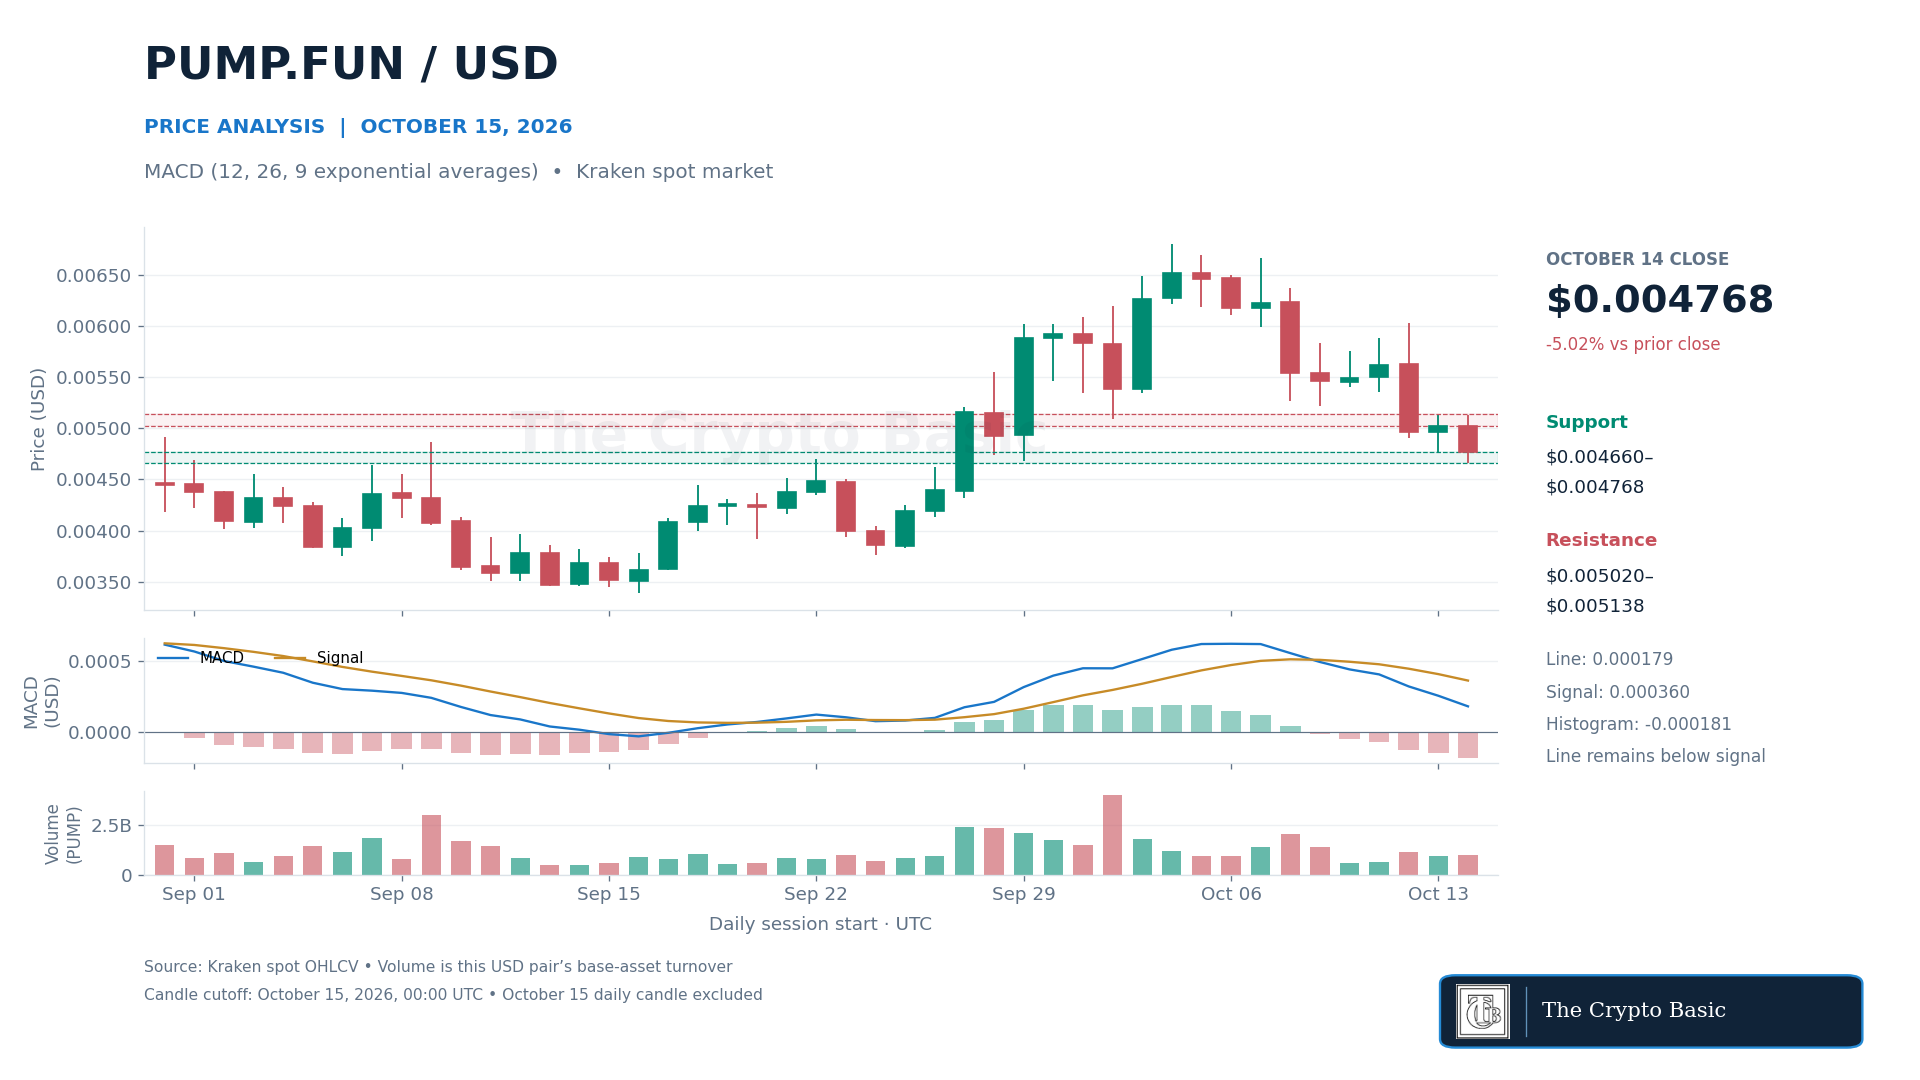
Its repeat inclusion follows a material change in the setup: the price was approximately 13.8% below the $0.005050 area recorded in the October 13 report.
The completed daily candle fell 5.02% to $0.004768. On the standard 12,26,9 MACD, the line stood at $0.000179 versus a $0.000360 signal line.
The histogram widened to negative $0.000181 from negative $0.000152. This was not a new crossover; it was a confirmed expansion of negative momentum on a completed daily candle.
The subsequent four-hour candle traded as low as $0.004000 and closed at $0.004347.
That placed the live market below completed support at $0.004660–$0.004768, but only a daily close below $0.004660 would confirm the break.
Such a close would expose the lower Bollinger reference near $0.004211, followed by $0.004000 and the September 25 low at $0.003832.
A close back above $0.005020–$0.005138 would invalidate the immediate breakdown and bring the 20-day EMA at $0.005288 into focus.