



As bulls continue to lose strength, XRP price risks falling below $1.00, especially after losing its 50-day moving average.
Widely followed analyst 360Trader highlighted this warning on X, noting a fair value gap (FVG) below the token’s current price.
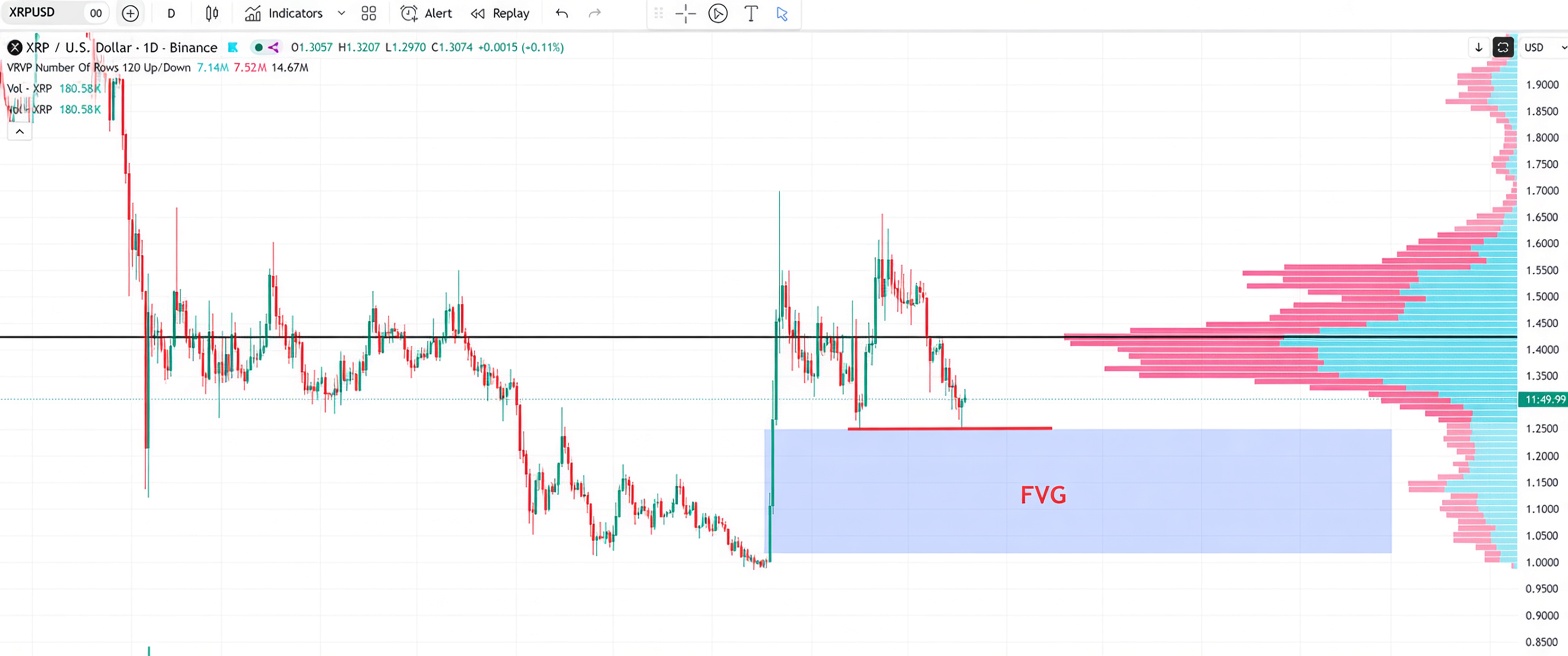
The analyst said XRP was trading near its 200-day moving average at approximately $1.28 after losing the 50-day average. He also pointed to an unswept low below the current price and warned that a breakdown could expose XRP to a liquidity zone extending toward $1.00.
Meanwhile, the analyst suggested that the potential decline could present a buying opportunity. Specifically, he noted that if XRP reaches $1.00, he would be ready to accumulate more tokens.
XRP Chart Highlights $1.28 as a Key Level
The XRP/USD chart shows the token trading around $1.31. The $1.28 area near the 200-day moving average is serving as a key level to watch. Below it, the blue-shaded fair value gap extends toward $1.00, marking the downside zone highlighted by 360Trader.
The volume profile also shows concentrated trading activity around $1.35–$1.45, an area XRP may need to reclaim to strengthen its recovery attempt.
Can XRP Price Avoid a Drop to $1.00?
Holding above $1.28 could help XRP stabilize, while a breakdown may bring the lower liquidity zone into focus. At press time, XRP was trading at $1.29, down 6% over the past week.
Meanwhile, many market commentators are also sharing this bearish outlook on X. For instance, commenting on 360Trader’s post, analyst ChartNerd reiterated his long-standing prediction that XRP would dip below $1 again in 2026.
$XRP to revisit $1 territory by EOY. https://t.co/Szu3VnaO7O
— 🇬🇧 ChartNerd 📊 (@ChartNerdTA) October 13, 2026
Likewise, analyst Gerla has warned that XRP’s outlook is weakening after the latest weekly candle fell below a key indicator. He noted that a move below the 200-day exponential moving average (EMA) would back bearish momentum.
However, reclaiming $1.37 could improve the outlook for XRP. The coin must also break above its weekly 50-period moving average near $1.49 to strengthen its recovery prospects.
Despite the weakness, historical patterns suggest that XRP is approaching the bottom of its bear cycle. Its monthly chart shows the price below the 50-period moving average but above the 100-period average near $0.84, leaving room for a retest of $1.00 or a further decline toward $0.84.
Hope Remains
However, these analysts insist that their predictions concern only XRP price short-term performance and do not affect their long-term outlook.
For instance, 360Trader’s bearish post also references his longer-term expectations for growth in the cryptocurrency market. The analyst cited predictions that trillions of dollars could flow into the market, although the timing and potential impact on XRP remain uncertain.