




XRP has returned to a lower price region around $1.20-$1.25, bringing the asset into an area that could complete a broader corrective structure if buyers begin defending the current range.
The XRP/USDT perpetual daily structure on Bybit places XRP near $1.2516 on Nov. 2, closely matching the current spot price near $1.25.
Trader Kayne, formerly known as Penguin, said XRP has now reached the lower area he had been watching. With several downside zones across the market already tested and timing beginning to align, he said the current conditions give him little reason to remain bearish.
The chart supports that view through an Elliott Wave structure that treats XRP’s latest decline as a potentially mature correction rather than the beginning of a new major downtrend.
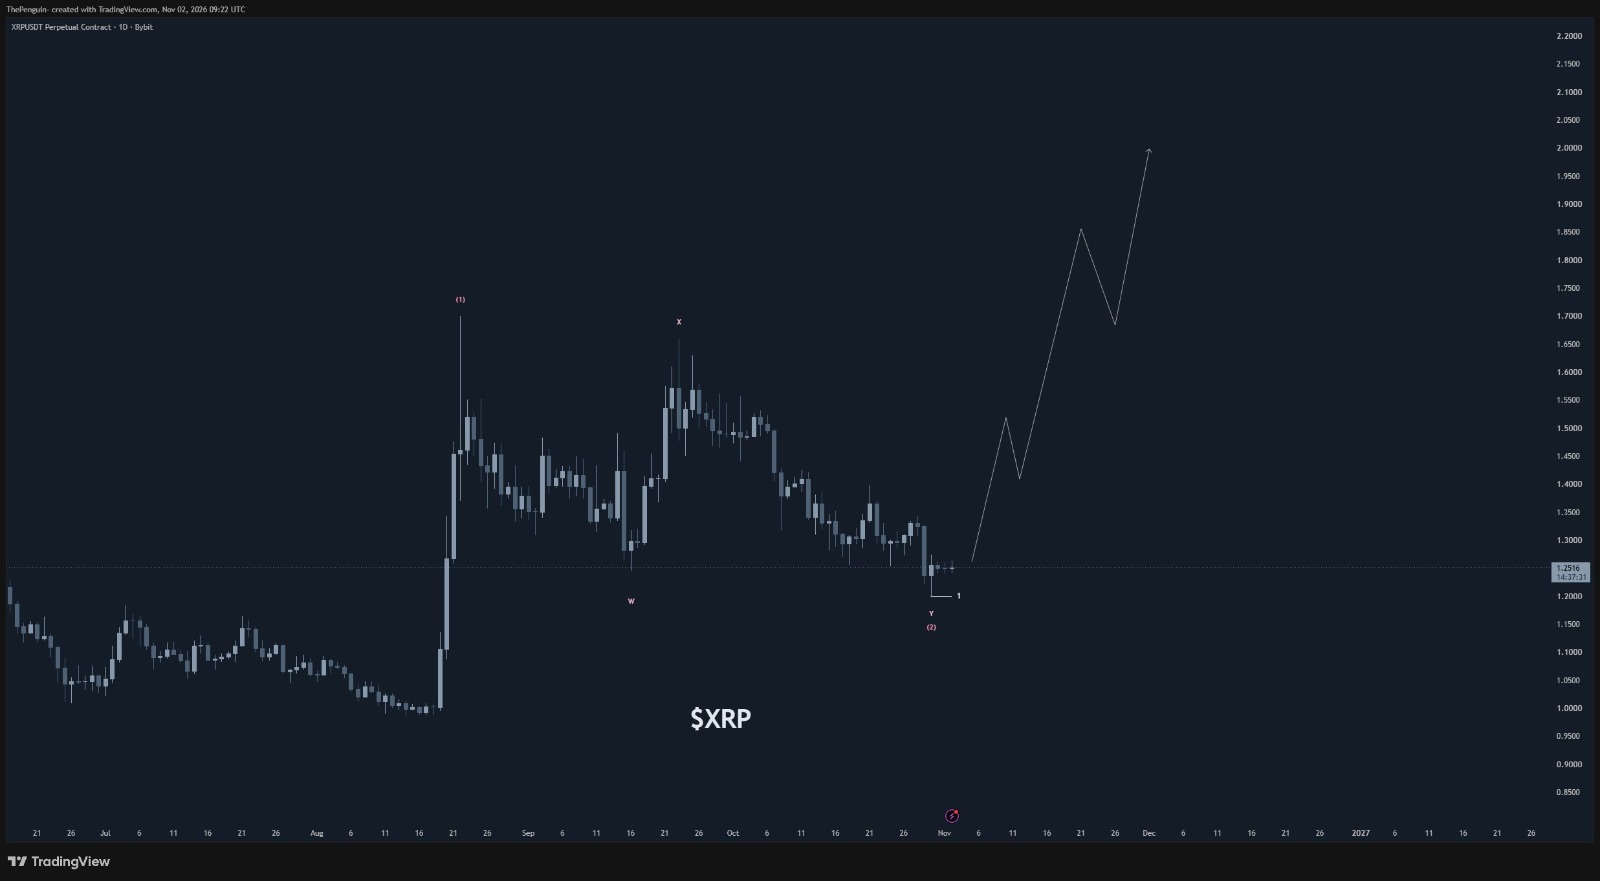
XRP Correction Develops Into W-X-Y Structure
XRP first established a major low near $1 in August before producing a sharp expansion.
Price quickly rallied through $1.20 and $1.30 before reaching the $1.50 region, with the strongest wick extending toward approximately $1.70. That initial advance is marked as Wave (1).
Instead of continuing immediately higher, XRP then entered a more complicated correction.
The first decline is marked W, taking price back toward the $1.28-$1.30 area during September. XRP subsequently recovered and approached the upper $1.50s, creating the X wave.
That recovery failed to establish a lasting breakout.
Selling resumed through October, with XRP producing a series of lower highs before returning toward $1.25. The current decline is marked as Y, while the same region is also labeled as the potential completion of the larger Wave (2).
This is the key part of the setup. If Y and Wave (2) are completing near current prices, the correction that followed the August expansion could be approaching exhaustion.
The structure also aligns with the $1.25 support area previously identified as an important XRP rebound level.
$1.20-$1.25 Becomes the Main Area to Defend
The lower boundary on the chart sits close to $1.20-$1.21, while XRP currently trades around $1.25.
That leaves relatively little room before the proposed Wave (2) low would face a more serious test.
The Crypto Basic has previously highlighted $1.25 as critical support with downside risk toward $0.98 if it fails.
For the current Elliott Wave interpretation to strengthen, XRP first needs to stop producing lower lows around this region and begin reclaiming nearby resistance.
A sustained break materially beneath $1.20 would weaken the idea that Wave (2) is ending here and require the bullish count to be reassessed.
XRP Projection Maps Several Upside Stages
The projected path does not show XRP moving directly from $1.25 to $2.
Instead, it maps a stair-step recovery.
The first projected advance reaches approximately $1.50-$1.52, followed by a retracement toward roughly $1.40. A second expansion then extends toward approximately $1.85, before another correction toward the upper $1.60s.
The final projected leg reaches approximately $2.
From the $1.2516 starting price displayed on Nov. 2, reaching $1.50 would require an increase of about 19.8%. A move to $1.85 would represent roughly 47.8%, while $2 would require an advance of approximately 59.8%, based on our calculations.
Those levels are a projected Elliott Wave path rather than confirmed targets.
Before the larger scenario becomes relevant, XRP must first reclaim the areas lost during October. Previous weekly analysis has also shown XRP’s broader Elliott Wave structure depending on the completion of Wave 2 before the next expansion.
For now, the decisive test remains much closer: whether XRP can establish a durable low around $1.20-$1.25 and turn the current Y-wave decline into the completion of Wave 2.