




Bitcoin has entered the post-2026 U.S. midterm period near $77,000, bringing back a historical pattern that saw BTC establish a lower price after each of the previous three midterm elections before eventually recovering.
The 2026 U.S. midterm election took place on Nov. 3, with Bitcoin closing that day around $77,345.
The long-term comparison places the 2014, 2018, 2022 and 2026 midterms on Bitcoin‘s logarithmic price chart. What stands out is how quickly BTC reached a notable low after each completed election cycle: 71 days after the 2014 vote, 39 days after 2018, and just one day after the 2022 election.
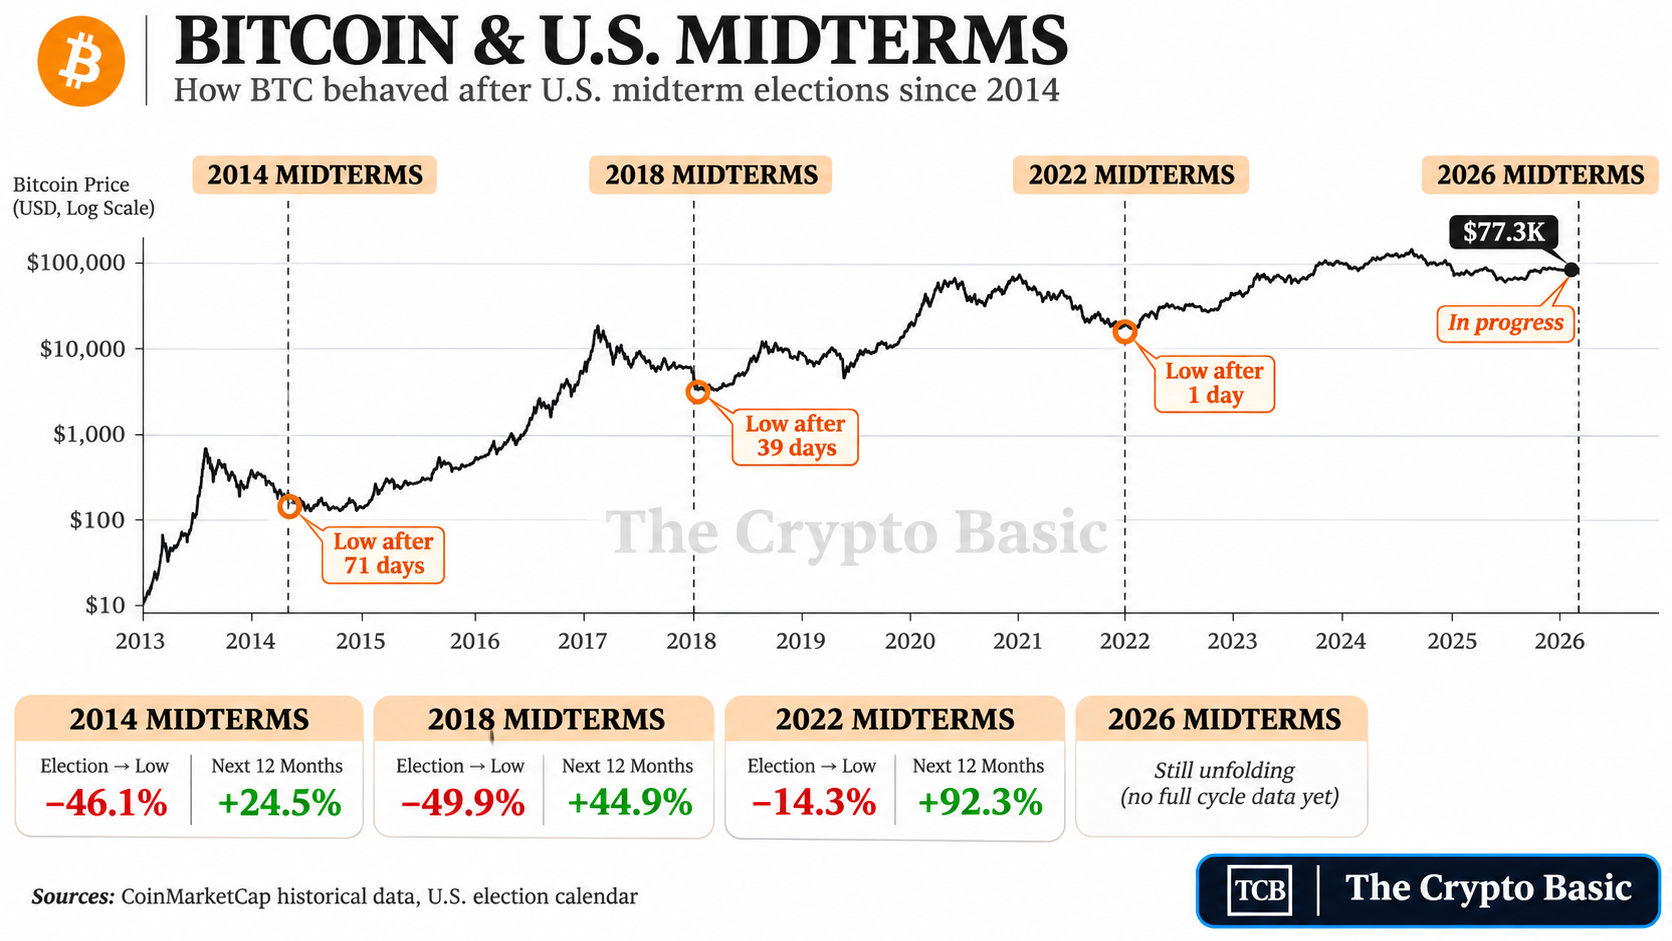
The pattern does not mean Bitcoin must immediately bottom after the 2026 vote, but the previous cycles show that midterm periods have coincided with important market turning zones.
Bitcoin Fell 46% After the 2014 Midterms
The 2014 U.S. midterms took place on Nov. 4, when Bitcoin traded around $330.49.
BTC did not bottom immediately. Instead, the decline continued for another 71 days, eventually reaching approximately $178.10 on Jan. 14, 2015.
From the election-day price, that represents a decline of approximately 46.1%.
The chart therefore captures the 2014 election during an established bear market rather than at the exact bottom.
However, the story changed over the following year. A previous The Crypto Basic review of Bitcoin’s post-midterm history found that Bitcoin was 24.5% higher 12 months after the 2014 midterms.
Bitcoin Lost Nearly 50% After the 2018 Vote
The most severe immediate post-election decline came in 2018.
Bitcoin closed around $6,461 on Nov. 6, 2018, before falling to approximately $3,237 by Dec. 15, 39 days later.
That equates to a decline of roughly 49.9%.
The 2018 example is particularly important because it shows why the midterm pattern should not be interpreted as an immediate bullish signal. Bitcoin lost almost half its value before establishing the bear-market bottom.
Yet BTC was still 44.9% higher 12 months after the election, according to the same historical comparison.
2022 Bottom Arrived Much Faster
The 2022 midterms produced a very different timeline.
Bitcoin was worth approximately $18,541 on Nov. 8, election day, before dropping to about $15,881 on Nov. 9.
That was a 14.3% decline in one day, matching the chart’s marker for an immediate post-election low.
There is one important nuance: Bitcoin later recorded a slightly lower intraday cycle low near $15,479 on Nov. 21, as the FTX crisis continued to pressure the market.
Still, most of the decline occurred almost immediately around the election period.
Bitcoin subsequently reversed course, with the asset posting a 92.3% gain over the 12 months following the 2022 midterms.
Post-Midterm Lows Have Arrived Faster Each Cycle
The chart highlights an unusual progression:
- 2014: low after 71 days, roughly -46.1%
- 2018: low after 39 days, roughly -49.9%
- 2022: initial low after 1 day, roughly -14.3%
At the same time, Bitcoin finished the subsequent 12-month period higher after all three elections: +24.5%, +44.9% and +92.3%, respectively.
That creates two very different historical lessons.
Midterms have previously occurred close to major Bitcoin bear-market turning points, but buying immediately after the vote would have exposed investors to substantial additional downside in both 2014 and 2018.
The sample is also limited to only three completed Bitcoin midterm cycles, making it too small to establish a dependable seasonal rule.
What the 2026 Setup Looks Like
The chart places Bitcoin around $78,100 near the 2026 election marker. CoinMarketCap’s completed Nov. 3 session closed somewhat lower at $77,345, while BTC remains around the $77,000 region on Nov. 4.
That comes after Bitcoin recently lost important short-term support. The latest The Crypto Basic Bitcoin price analysis identified weakness below $77,000 with momentum approaching oversold territory.
Bitcoin has also just absorbed the $6.3 billion Binance hack and heavy ETF selling, adding another variable that was absent from previous election cycles.
History therefore puts the post-midterm period in focus, but it does not establish that the 2026 low is already in.
The next question is whether Bitcoin can stabilize around the current $76,000-$77,000 region or whether the fourth midterm cycle will again require a deeper post-election decline before a durable recovery begins.
Bitcoin Price Prediction 12 Months After 2026 U.S. Midterms
Bitcoin’s previous U.S. midterm cycles suggest the market could still face another post-election decline before a broader recovery develops into 2027.
BTC is trading around $76,500, close to its Nov. 3 election-day closing price of approximately $77,345. Using that election-day close as the reference point, previous midterm-cycle declines and subsequent 12-month recoveries produce several possible price scenarios.
| Scenario | Historical precedent | Implied BTC level |
|---|---|---|
| Mild post-midterm correction | 2022: -14.3% | $66,300 |
| Deep correction | 2014: -46.1% | $41,700 |
| Severe correction | 2018: -49.9% | $38,750 |
| 12-month conservative recovery | 2014: +24.5% | $96,300 |
| 12-month middle case | 2018: +44.9% | $112,100 |
| 12-month bullish case | 2022: +92.3% | $148,700 |
$60,000-$66,000 Emerges as the Main Downside Scenario
The more moderate historical setup places Bitcoin between $60,000 and $66,000 before a stronger recovery develops.
The three previous post-midterm declines were 46.1% in 2014, 49.9% in 2018 and 14.3% in 2022. At the same time, the period needed to reach an important post-election low compressed sharply from 71 days in 2014 to 39 days in 2018 and just one day in 2022.
If that tendency toward faster post-election lows continues, the most important window for Bitcoin could fall between November and early December 2026.
Applying the 2022 decline of 14.3% to the $77,345 election-day close produces a price near $66,300, making this the first history-derived downside level.
A more severe correction toward $50,000-$55,000 would require the current cycle to resemble the deeper declines seen in 2014 and 2018.
The simple average of the three previous post-midterm declines is approximately 36.8%. Applying that decline to $77,345 produces a price near $48,900. This represents a bearish stress scenario rather than the central case, particularly because the 2014 and 2018 observations occurred during markedly different market conditions.
Bitcoin Could Target $110K-$120K Within 12 Months
The post-midterm recovery record has been more consistent.
Bitcoin was higher 12 months after each of the three previous midterm elections, gaining 24.5% after 2014, 44.9% after 2018 and 92.3% after 2022.
The median of those three returns is 44.9%. Applying that gain to the 2026 election-day price would place Bitcoin around $112,100 by November 2027.
The average 12-month return is approximately 53.9%, which would put BTC near $119,000.
This creates a broader historical scenario with four areas to watch:
Potential post-midterm low: $60,000-$66,000
Bearish stress case: $49,000-$55,000
November 2027 base range: $110,000-$120,000
Bullish historical-repeat scenario: $145,000-$150,000
Importantly, none of the previous three midterm cycles produced an uninterrupted rally immediately after election day. Bitcoin first traded below its election-day price before eventually recovering.
If 2026 develops along a similar broad path, another correction could precede the stronger move into 2027. However, only three completed midterm cycles are available, so these levels should be treated as historical price scenarios rather than statistical forecasts.