




XRP has suffered a substantially deeper selloff than Bitcoin, Ethereum and Solana since Nov. 4, falling 23.4% over the measured period as price breaks through successive support levels toward $1.
The comparison tracked the four assets from Nov. 4 through the Nov. 10 market snapshot. XRP recorded the largest decline at 23.4%, followed by Ethereum at 18.2%, Solana at 17.0%, and Bitcoin at 10.4%.
That means XRP underperformed Bitcoin by roughly 13 percentage points, Ethereum by 5.2 points, and Solana by 6.4 points.
EGRAG Crypto highlighted three possible explanations for the outsized XRP decline: a leverage flush, selling by long-term holders, or deliberate liquidity hunting.
He assigned subjective weights of 30%, 20%, and 50%, respectively, while stressing that the estimates are personal assessments rather than established probabilities.
XRP Falls Harder Than the Other Majors
The four-market comparison shows a clear difference in severity.
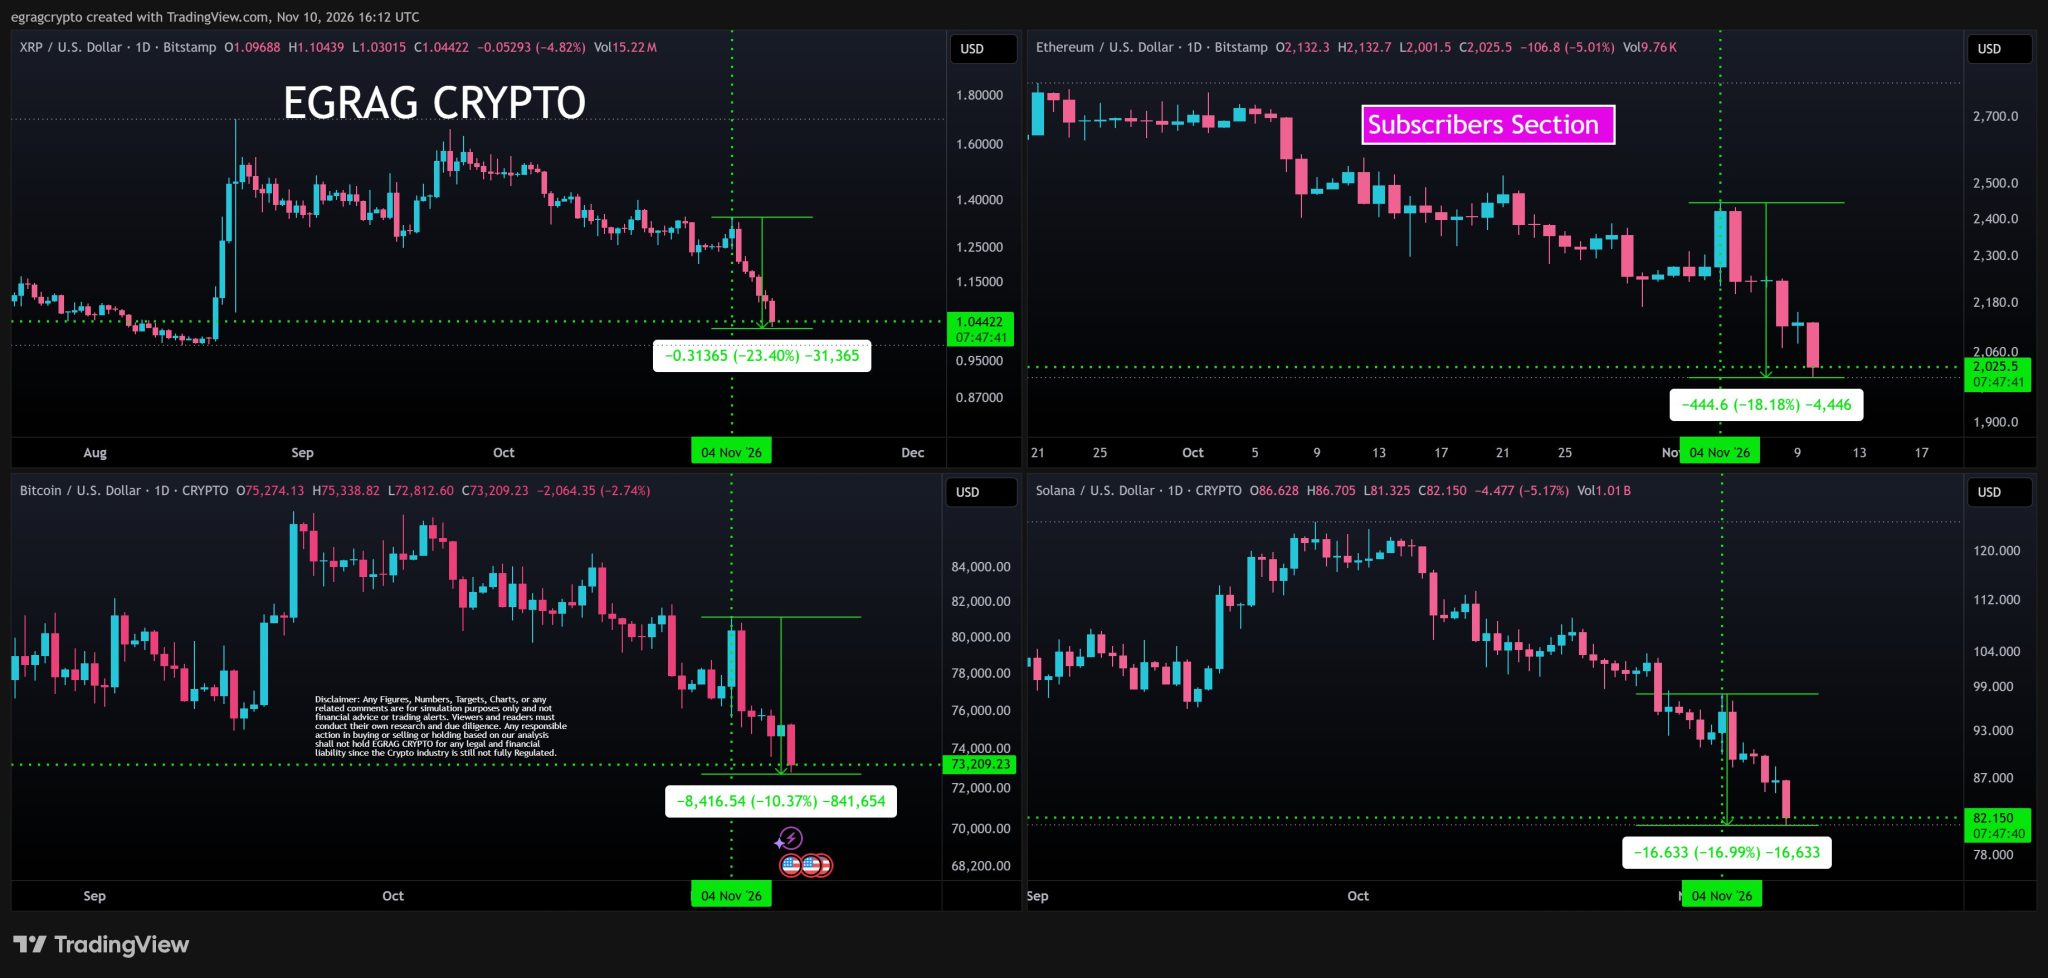
Bitcoin declined from roughly the low-$81,000 region toward $73,000 during the measured move. Ethereum fell from approximately $2,475 toward $2,025, while Solana dropped from around $99 to $82.
XRP’s decline was steeper, moving from roughly $1.36 to $1.04.
The difference matters because XRP entered the selloff with a fragile technical structure. Price had already lost the $1.24-$1.26 region and was carrying heavy leveraged-long exposure below spot.
The Crypto Basic previously reported that XRP had roughly 5.6 times more modeled long-liquidation exposure below spot than short exposure above. That positioning provided a mechanism through which falling prices could force additional longs out of the market.
This gives the leverage-flush explanation some observable support, although it cannot by itself explain the entire 23.4% decline.
Long-Term Holder Selling Remains Unproven
EGRAG’s second scenario involves early XRP holders taking profits or rotating into other assets.
The price comparison alone cannot establish that. A decline in price can result from many different combinations of spot selling, derivatives liquidations, reduced bids and broader risk-off positioning.
Without wallet-level evidence linking specific long-term holders to exchange deposits and sales, claims that “OGs” are driving the decline remain speculative.
In fact, recent on-chain activity has also shown some large holders accumulating during weakness, complicating the idea that whales are uniformly selling.
Manipulation Cannot Be Established From Price Action Alone
EGRAG assigned the largest subjective weight—50%—to a deliberate liquidity hunt designed to shake weaker holders out of XRP.
That interpretation cannot be confirmed from the price action alone.
Large, rapid declines can resemble stop hunts because leveraged positions cluster around obvious support levels. Once those levels fail, forced liquidations and stop orders can accelerate the move without requiring coordinated manipulation.
The recent sequence illustrates that dynamic. XRP first lost $1.19, then $1.14 and $1.10 as the market moved through successive downside liquidity zones. The $1.10 region had already been identified as a major target after XRP lost $1.26.
$1.00-$1.04 Becomes the Critical XRP Zone
XRP now trades around $1.05, leaving the $1.00-$1.04 region as the immediate area buyers need to defend. CoinMarketCap currently shows XRP down roughly 17% over seven days.
This overlaps with the major fair value gap extending toward $1 and follows the loss of the $1.07 support zone.
On the upside, XRP would first need to reclaim approximately $1.15, followed by $1.20-$1.25, before the short-term structure begins materially improving.
For now, the clearest confirmed explanation is that XRP entered the broader selloff with weaker market structure and substantial leveraged-long exposure. Whether longer-term holder selling or intentional liquidity hunting contributed meaningfully remains unproven