



Bitcoin has slipped below $80k as the bearish trend continues into the weekend. Will the declining BTC price hit $75k next?
In the past 24 hours, the crypto market has witnessed a liquidation of nearly $850 million. Amid the high liquidations, Bitcoin has broken under its $80,000 support level and is trading at levels last seen on November 10, 2024.
Currently, Bitcoin is moving at a market price of $79,616, with an intraday pullback of 5.9%. This marks a prolonged correction in BTC and hints at a potential retest of the 50% Fibonacci level at $75,000.
Bitcoin ETF Outflows Hit 8-day Streak
With another bearish outflow, U.S. spot Bitcoin ETFs lost $275.83 million on February 27. However, this represents a significant decline in intensity compared to the previous three trading days.
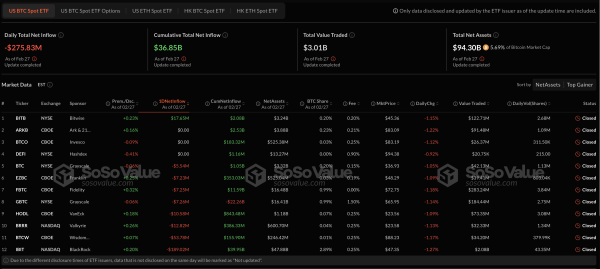
Bitwise remains the only ETF with an inflow of $17.65 million, while ARK, 21Shares, Invesco, and Hashdex are seeing net-zero flows. BlackRock offloaded a massive $189.02 million, followed by WisdomTree, which dumped $53.78 million. The remaining six outflowing ETFs recorded outflows ranging from $13 million to $5 million.
Whales Move 40,000 BTC in 96 Hours
According to a recent tweet by Ali Martinez, crypto whales have moved the largest amount of Bitcoin in the past 4 days. The analyst reports that whales have transferred 40,000 BTC in the past 96 hours.
This marks a notable decline in whale holdings, from 4.53 million BTC to 4.49 million BTC.
Whales have moved over 40,000 #Bitcoin $BTC in the last 96 hours! pic.twitter.com/NIByZRpy0w
— Ali (@ali_charts) February 28, 2025
Ki Young Ju, founder and CEO of CryptoQuant, suggests that Bitcoin is likely to experience extended consolidation. The price could dip to the $75k level before entering a potential consolidation range between $75,000 and $100,000, similar to early 2024.
During distribution phases, asset prices tend to drop if new liquidity dries up. With BTC’s declining price, the key question remains: Where will new liquidity come from?
The analyst expects the consolidation range to hold until either a sentiment boost for Bitcoin emerges or new liquidity enters the market.
#Bitcoin spot volume was highly active around $100K.
In distribution phases, prices drop when new liquidity dries up. The key question regarding whether the BTC market will face years of bear markets is: Where will fresh liquidity come from?
We’ll likely see an extended… https://t.co/orwYq8nvMD pic.twitter.com/3PQ40r08J3
— Ki Young Ju (@ki_young_ju) February 28, 2025
Bitcoin Follows Wyckoff’s Pattern, $75k Next?
Bitcoin’s price action reveals a bearish breakdown of the 61.80% Fibonacci level at $81,857. With its fourth bearish engulfing candle this week, Bitcoin has dropped to the $80,000 mark.
The daily chart, showing BTC’s price trend since September 2024, reveals a classic Wyckoff pattern, beginning with an uptrend. BTC underwent a distribution phase between $91,781 and $106,184.

Bitcoin Price ChartWith the overhead range breakout, BTC has now entered the markdown phase, suggesting a potential decline driven by increased supply.
Based on Fibonacci levels and the current rise in bearish momentum, Bitcoin is likely to test the 50% Fibonacci level. In the unlikely event of a bullish reversal, the immediate resistance for Bitcoin would be the 61.80% support-turned-resistance level at $81,855.