




Bitcoin and XRP slip as NEAR and Quant advance. October 6 crypto analysis covers five coins, key chart levels, and conditional bullish and bearish scenarios.
Bitcoin Holds Above Its Rising 20-Day Average
Bitcoin closed October 5 at $85,751.50 on Kraken, down 0.88% from $86,510.40. The session reached $86,973.60 before retreating, extending the pattern of approaches toward late-September resistance without a sustained daily break above it.
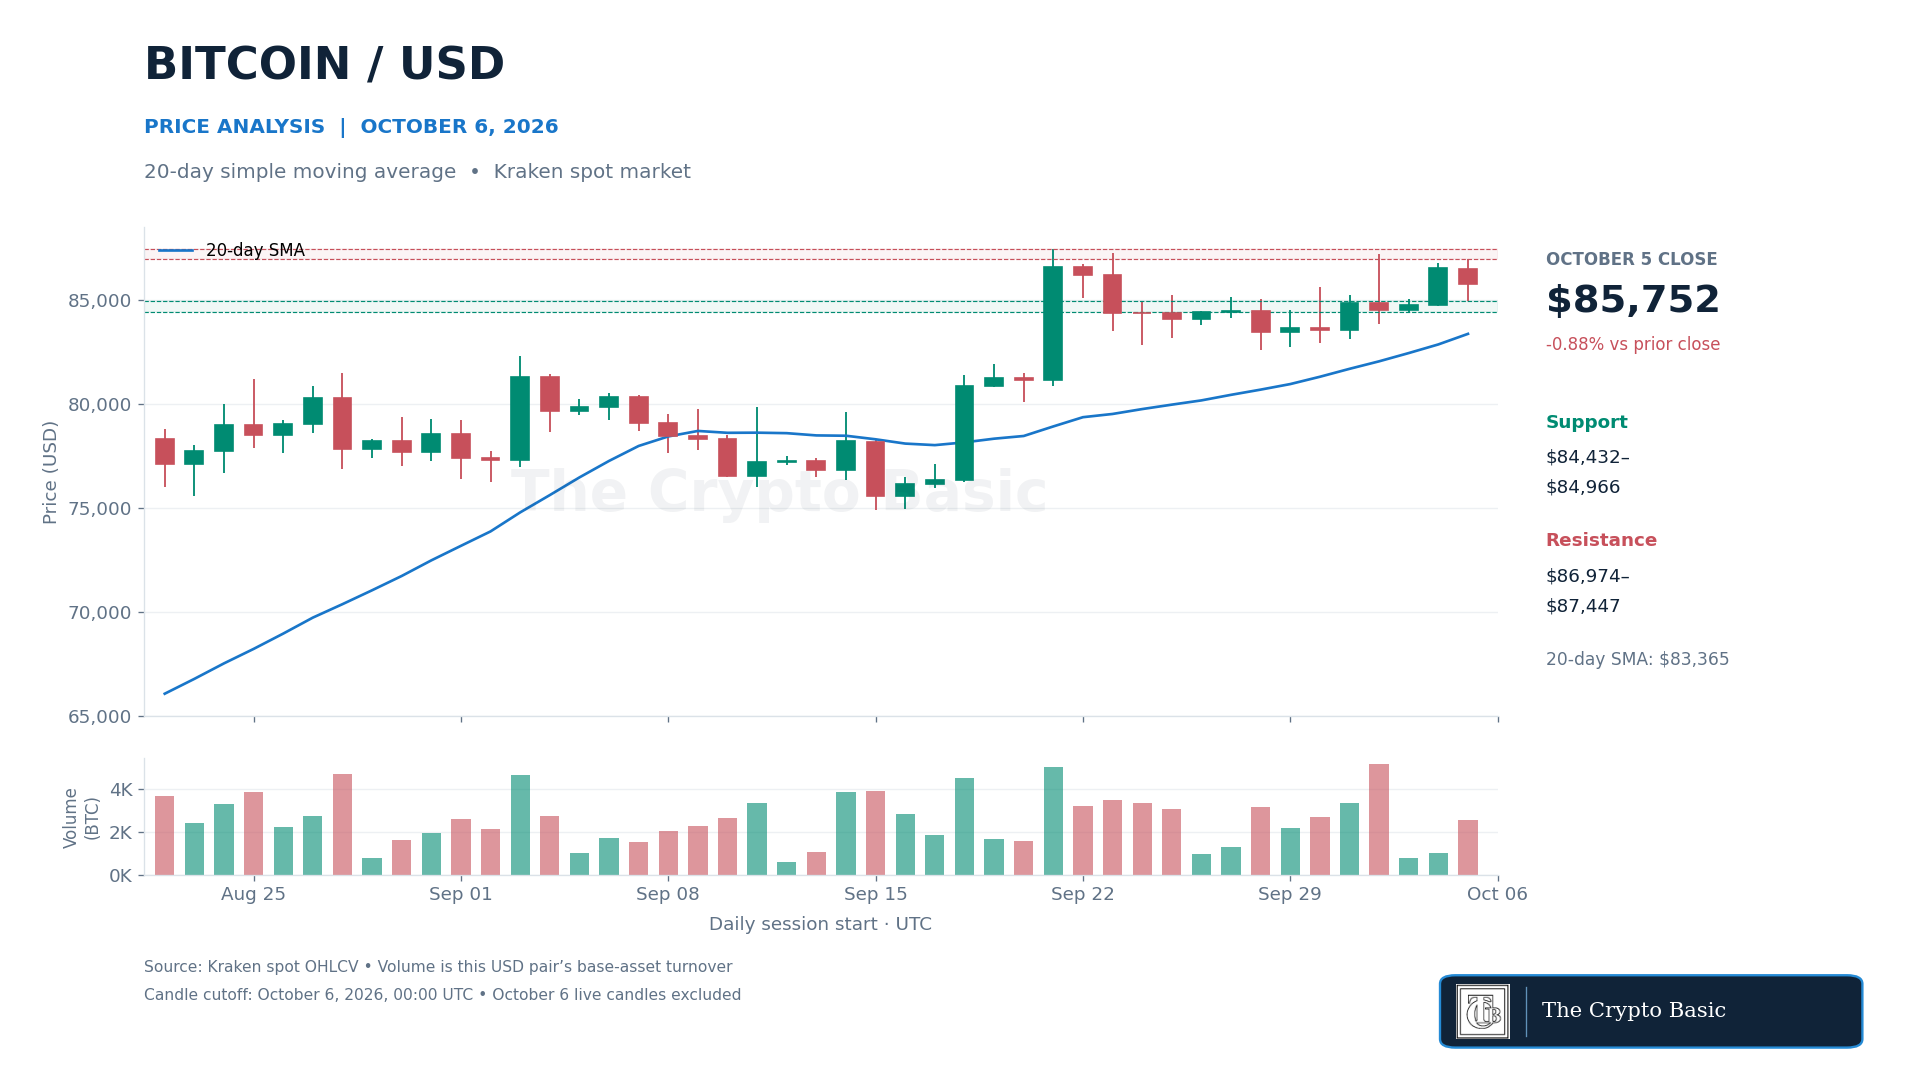
The 20-day simple moving average rose to $83,365.08 from $82,856.76. BTC Price remains above that rising average, preserving the broader recovery even as the latest candle weakened. The average sits below the immediate trading range, offering a deeper support reference rather than evidence that resistance has broken.
Monday’s report identified an unresolved resistance test. That condition persists: a daily close above $86,973.60 would clear the latest session high, while $87,229–$87,446.70 contains the October 2 and September swing highs on Kraken. A close above $87,446.70, followed by a successful retest, would provide stronger confirmation of range expansion.
The October 5 low at $84,965.70 is the first downside reference, followed by October 3’s $84,431.70 low. Losing $84,431.70 on a daily close would weaken the immediate recovery and expose $83,860.70, then the rising average. Bitcoin’s aggregate quote also fell from Monday’s $86,081 snapshot to $85,489, approximately 0.69% between reports.
XRP Momentum Cools While the Range Holds
XRP ended October 5 at $1.50748, down 0.83% from $1.52016. Its $1.53087 session high reached the lower edge of the resistance band discussed Monday, but the daily close remained beneath that boundary.
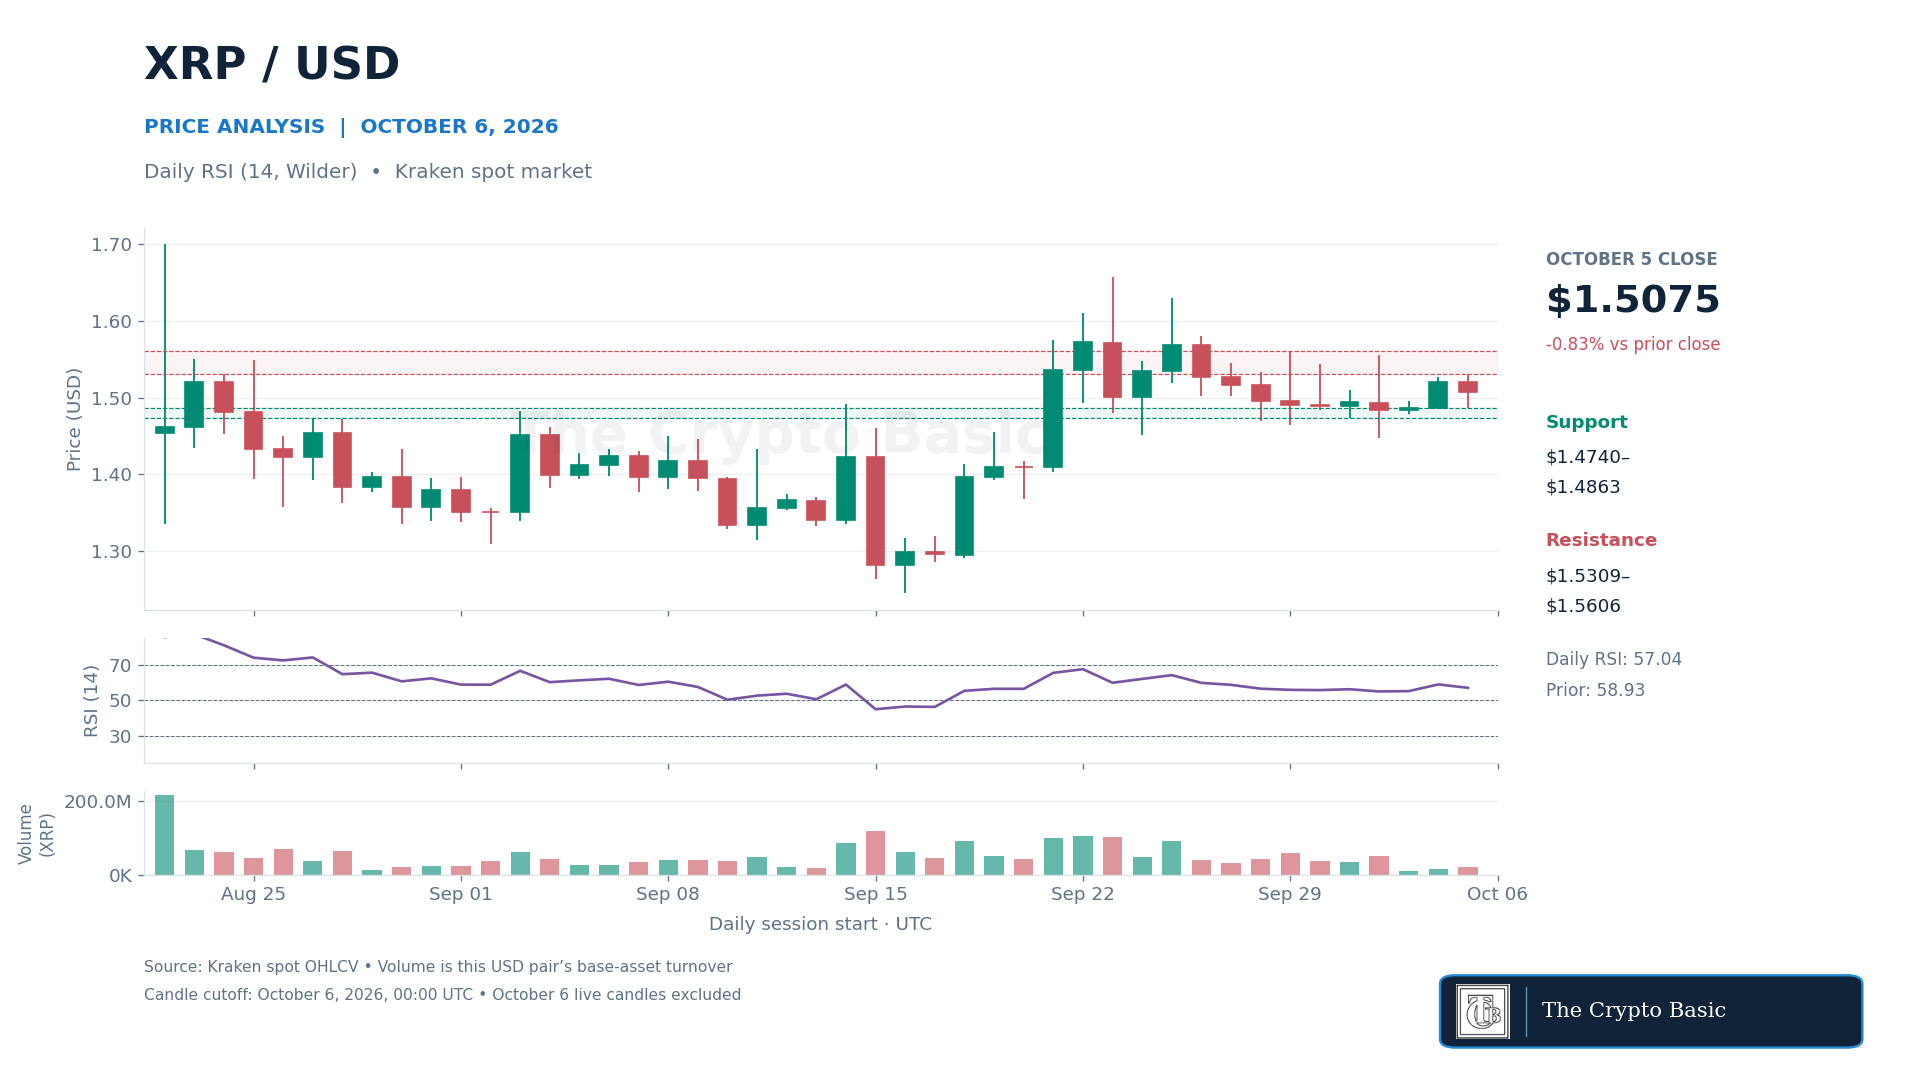
Daily RSI, calculated over 14 periods with Wilder smoothing, eased to 57.04 from 58.93. Momentum remains above the neutral 50 line, although the decline shows that the latest session did not extend the prior recovery. This is a cooling momentum reading, not an oversold signal or a confirmed bearish reversal.
Initial support lies at $1.48629, Monday’s low, and $1.47398, the October 1 low. A close below $1.47398 would shift attention toward the October 2 low of $1.44698 and weaken the range’s lower support structure.
For an upside attempt, XRP first needs a close above $1.53087. Clearing the September 29 high at $1.56056 would offer stronger confirmation and reopen $1.61. A subsequent return below $1.53 would weaken that breakout scenario. The central conclusion is unchanged from Monday: XRP has recovered from lower levels, but its principal resistance band remains intact.
NEAR Rebounds Toward the 78.6% Retracement
NEAR closed October 5 at $5.2903, up 7.61% from $4.9160, after reaching $5.3179. The close extended its recovery from the October 2 low but remained below the early-October and late-September highs.
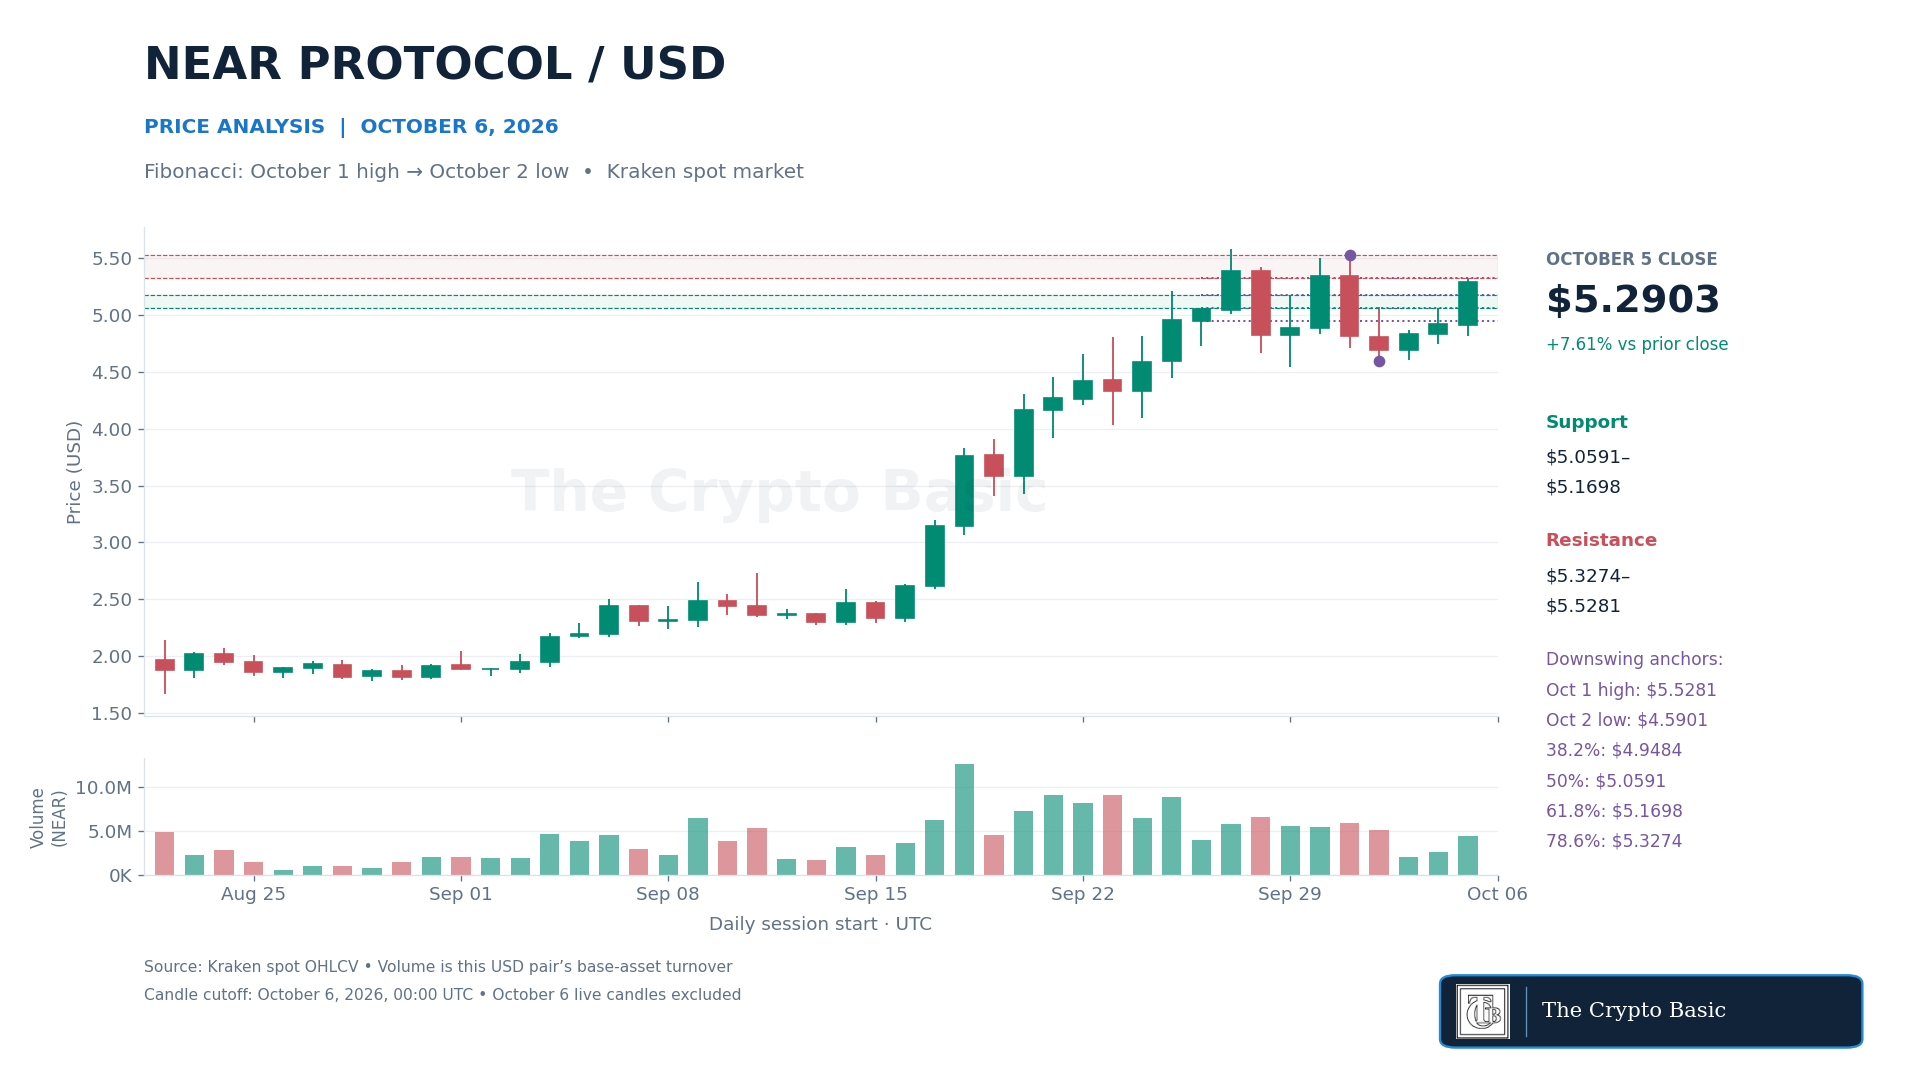
The Fibonacci map measures an upward retracement of the downswing from the October 1 high of $5.5281 to the October 2 low of $4.5901. The 38.2%, 50%, 61.8% and 78.6% recovery levels are $4.9484, $5.0591, $5.1698 and $5.3274, respectively.
Monday’s close reclaimed the 61.8% level but stopped below 78.6%. A completed daily close above $5.3274 would strengthen the recovery toward $5.5281. Beyond that, the September 27 high at $5.5778 remains the visible resistance reference. No extension target is assumed before those highs are cleared.
Holding $5.1698 would preserve the latest retracement recovery. A close back below it would weaken that signal and expose $5.0591, followed by $4.9484. Losing Monday’s $4.8125 low would provide a clearer price-structure invalidation. The earlier rally remains visible on the daily chart, but the rebound has not yet produced a new swing high.
Solana Consolidates Above the Bollinger Midpoint
Solana closed October 5 at $120.76, down 0.67% from $121.57. Its $122.04 daily high fell short of October 4’s $122.25 high, while the session low reached $118.93.
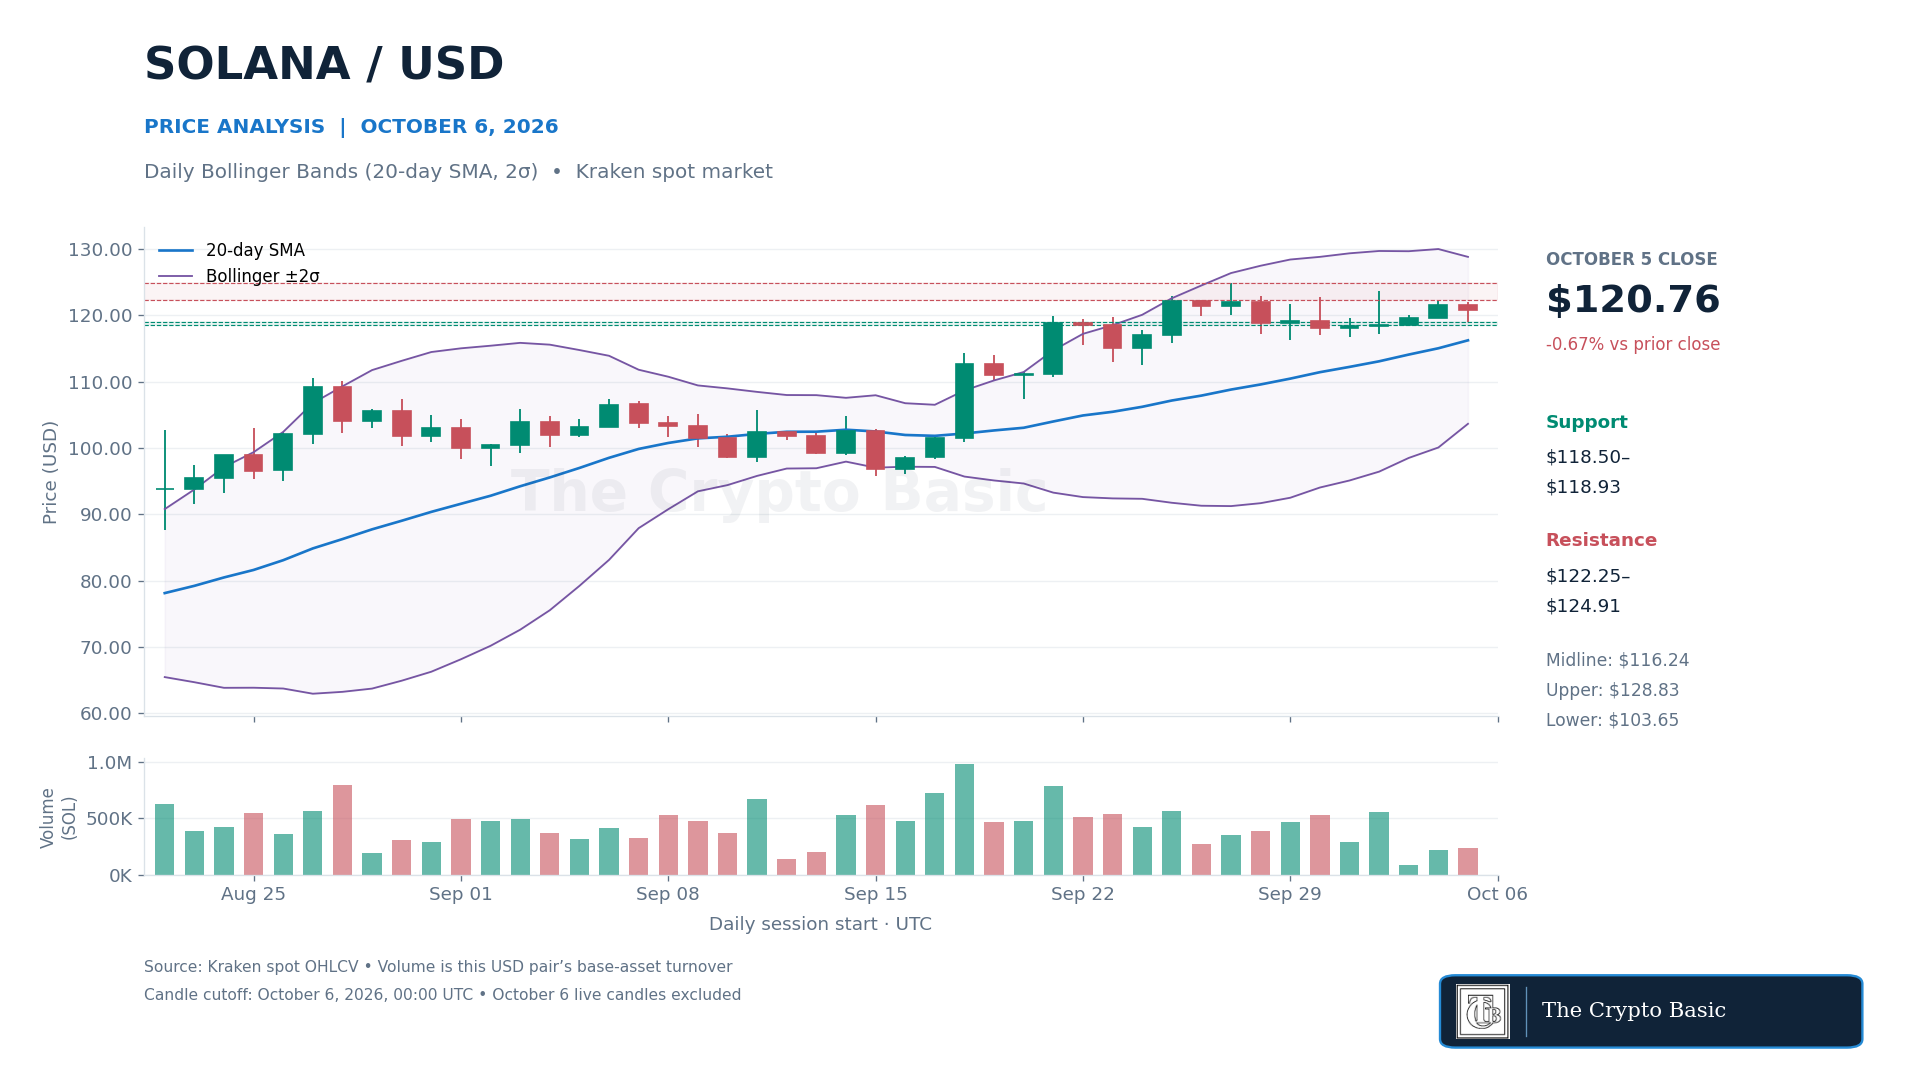
Daily Bollinger Bands, using a 20-day simple moving average and two population standard deviations, place the midpoint at $116.237, the upper band at $128.828 and the lower band at $103.646. SOL remains above the midpoint and inside the envelope. That combination supports a consolidation interpretation rather than a confirmed breakout.
A daily close above $122.25 would improve the immediate structure, but October 2’s $123.74 high and September 27’s $124.91 high remain further obstacles. Clearing $124.91 would make the changing upper band a relevant upside reference; it is not a guaranteed destination.
Support begins around $118.50–$118.93. A close below $118.50 would expose the recent $116.33–$117.21 lows and the nearby Bollinger midpoint. Losing that cluster would weaken the recovery structure, while a return below $122.25 after an upside break would invalidate the initial breakout attempt.
Quant Gains as Its MACD Histogram Contracts
Quant closed October 5 at $262.88, up 4.16% from $252.39. The candle recovered from a $245.43 low but remained below October 3’s $269.99 high and October 4’s $278.28 high.
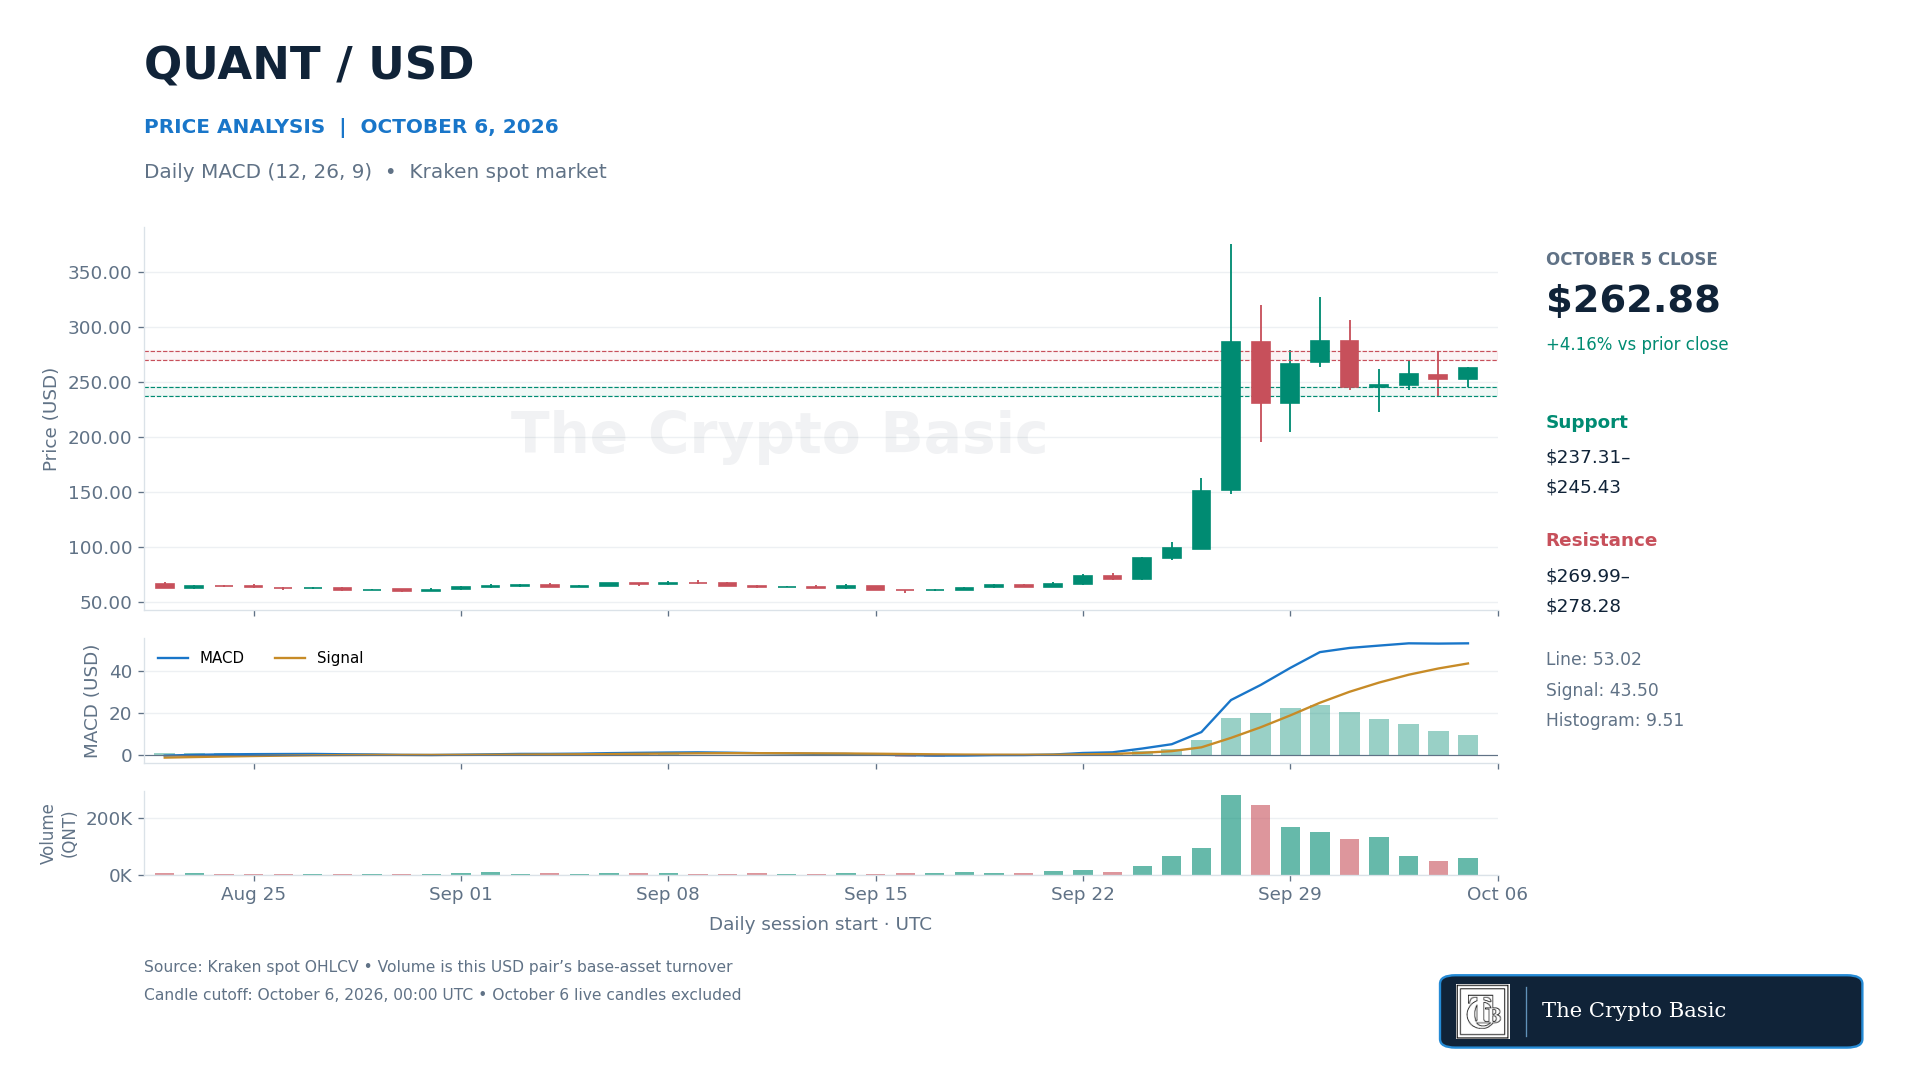
Daily MACD, using 12-, 26-, and nine-period exponential moving averages, stood at 53.02 against a signal line of 43.50. Both were above zero, with MACD still above its signal. However, the positive histogram narrowed to 9.51 from 11.76, extending its contraction across the latest five sessions.
That is slower positive momentum, not a newly confirmed bearish line/signal crossover. The distinction matters because QNT rose on the latest candle even as the gap between the MACD and signal lines narrowed.
A daily close above $269.99 would improve the short-term recovery, with $278.28 the next test. Clearing that level would reopen the September 30 closing area near $286.92 and October 1’s $306.10 high.
Conversely, a close below $245.43 would expose $237.31; losing that support would weaken the recovery and bring October 2’s $222.33 low into view. A return below $269.99 after a breakout would undermine the bullish confirmation.